- 19 -
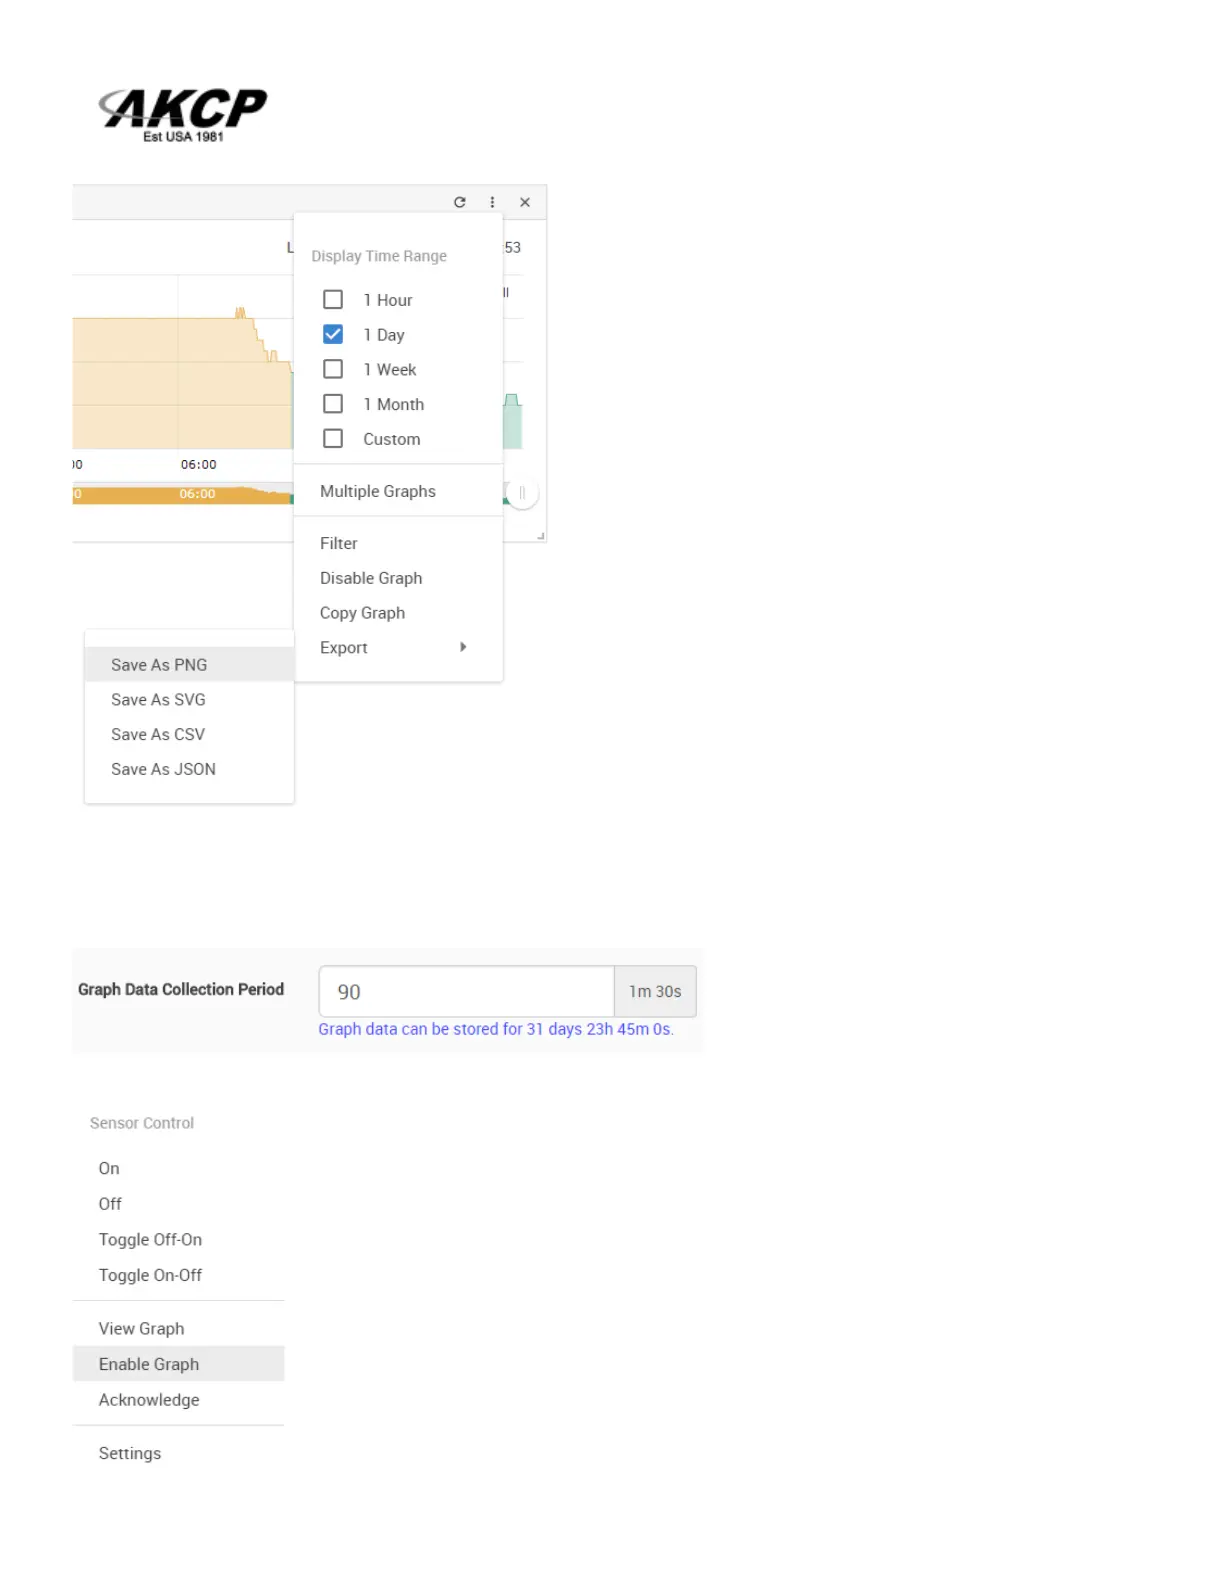
You can choose to export the graph data in selected
formats by clicking on the graph’s menu on the right,
then by choosing the desired format from the popup
menu.
The file will be downloaded automatically and
assigned a file name that will contain the sensor’s
name, IP address of the unit, and the date and time.
The graph is always a Live Graph; you can set the data collection period in the General Settings
page (see below for more information).
You may also refresh the graph data manually with the refresh button on the right.
If you want to view multiple sensor graphs, first you need to Enable Graph for a
sensor that supports graphing from the sensor’s menu. Then select View
Graph to display it. The data collection will run in the background even if you
don’t display the graph.
The second graph will appear below the first graph (you can freely rearrange it).