2.18 System debug
The MPS3 board provides several methods of performing debug.
CoreSight
™
debug
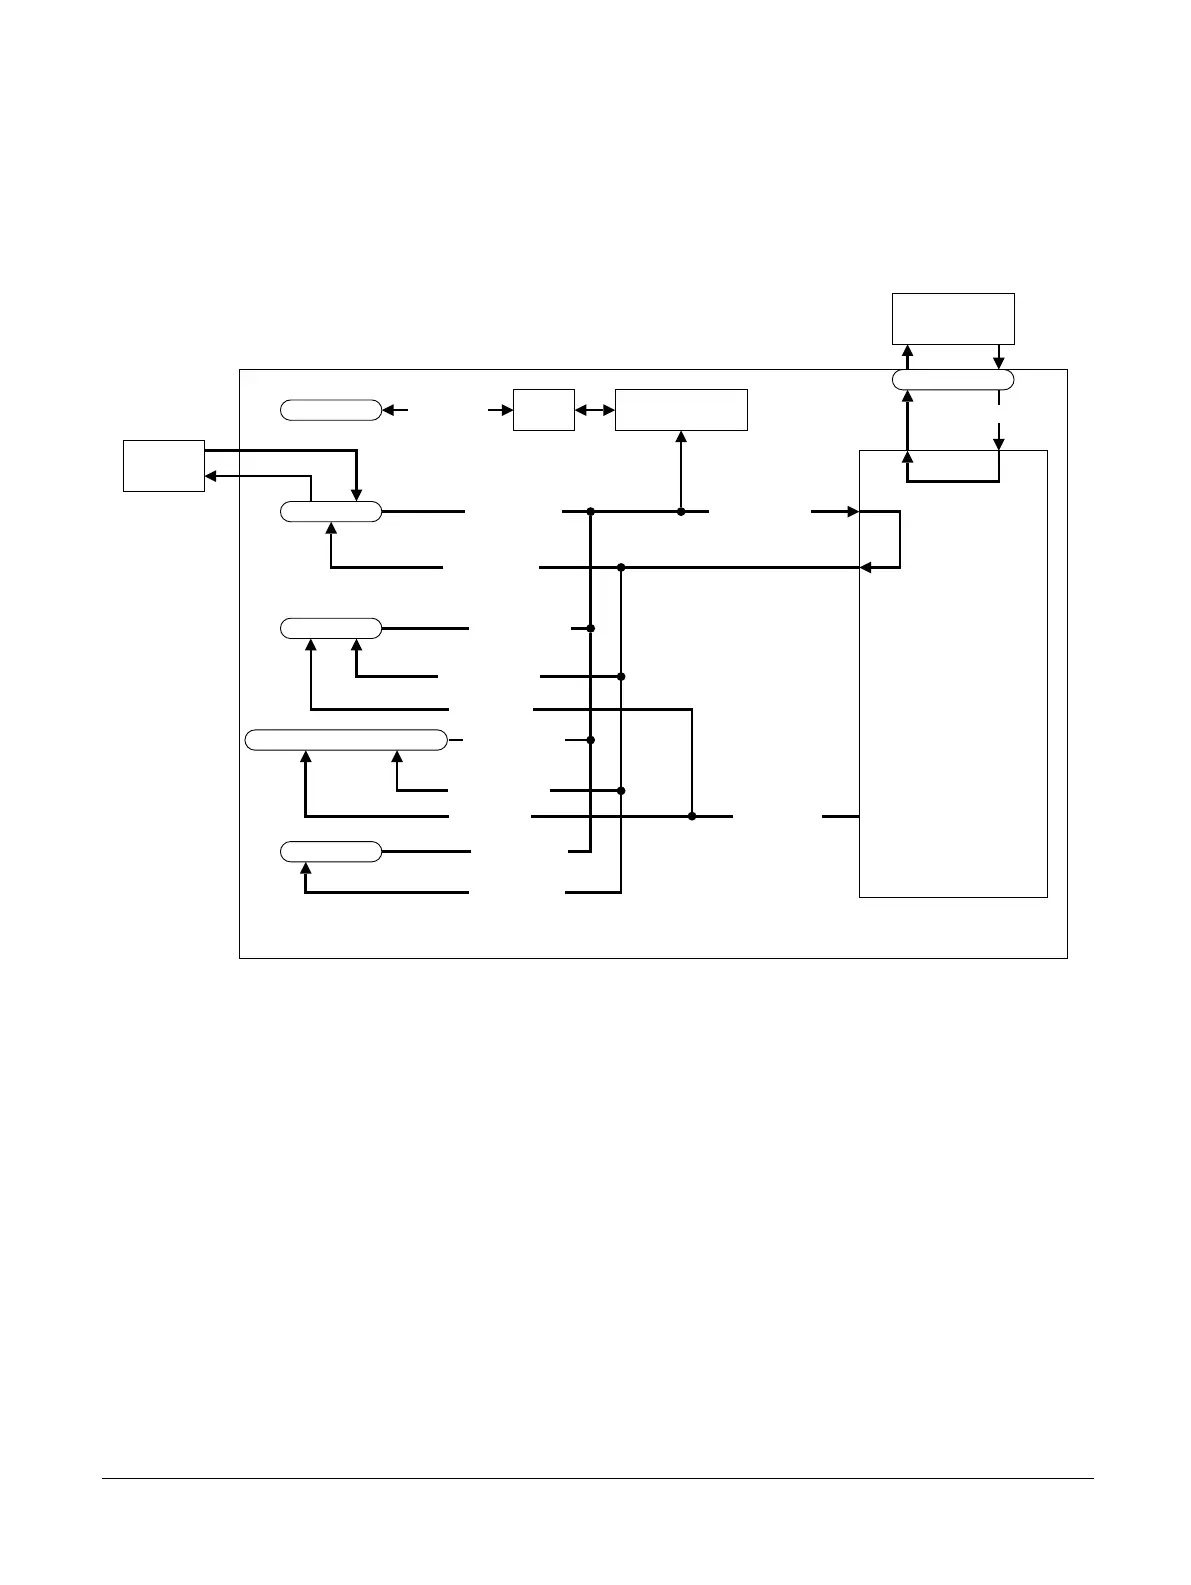
The following figure shows the MPS3 board debug and trace system.
MPS3 FPGA Prototyping Board
FPGA
Processor
debug
20-pin IDC
10-pin IDC
20-pin Cortex debug and ETM
MICTOR 38
CMSIS-DAP
P-JTAG/SWD
P-JTAG/SWD
P-JTAG/SWD
P-JTAG/SWD
P-JTAG/SWD
P-JTAG/SWD
P-JTAG/SWD
P-JTAG/SWD
4-bit Trace
4-bit Trace
16-bit Trace
16-bit Trace
JTAG 14
ILA
device
F-JTAG
P-JTAG/SWD
Debug USB
USB
hub
CMSIS-DAP
controller SWD only
CMSIS-DAP
Figure 2-24 MPS3 board CoreSight debug and trace
• P‑JTAG processor debug on:
— 20‑pin IDC connector.
— 10‑pin IDC connector.
— 20‑pin Cortex debug and ETM connector.
— 38‑pin MICTOR connector.
• Serial Wire Debug (SWD) on:
— 20‑pin IDC connector.
— 10‑pin IDC connector.
— 20‑pin Cortex debug and ETM connector.
— 38‑pin MICTOR connector.
— CMSIS-DAP debug over USB on the Debug USB connector, USB 2.0 type B connector.
• 16‑bit trace on a 38‑pin MICTOR connector.
• 4‑bit trace on a 20‑pin Cortex debug and ETM connector.
• FPGA debug on 14‑pin ILA connector for FPGA debug.
2 Hardware description
2.18 System debug
100765_0000_04_en Copyright © 2017–2020 Arm Limited or its affiliates. All rights
reserved.
2-50
Non-Confidential



 To Next Page