15
Pressing any of the buttons will show the results more rapidly.
Up to 5 results are automatically saved in the data memory. Incorrect measurements indicated
XJUIi&SSwBSFOPUTBWFE
5.4 Measured data recall
The weight and the body fat percentage of the last 5 measurements can be recalled on this scale.
– Switch on the scale by briefly stepping on the platform.
– Select the memory position in which your personal parameters are stored by pressing the
i6TFSwCVUUPOTFWFSBMUJNFT5IFTFUIFOBQQFBSJOUVSOVOUJMUIFiwEJTQMBZBQQFBST
o"TTPPOBTiwBQQFBSTZPVDBOSFDBMMUIFMBTUNFBTVSFEXFJHIUBOEUIFCPEZGBUQFSDFOU-
age with the up button
▲. Both values appear for 2 seconds in each case.
– Press the up button ▲ repeatedly to display the next older data. After a maximum of 5 meas-
VSFNFOUTUIFTDBMFSFUVSOTUPUIFiwEJTQMBZBOEJTSFBEZGPSNFBTVSFNFOU
If user settings are changed (e.g. age), the measured data memory is deleted.
&WBMVBUJPOPGSFTVMUT
Trend display
This scale hase a trend display, in which the value currently measured is compared with the av-
erages of the last 5 measurements.
– Trend display up
▲: present value is higher than the average of the last 5 measurements.
– Trend display down ▼: present value is lower than the average of the last 5 measurements.
– Trend display up and down
▲ ▼: present value is the same as the average of the last 5
measurements.
Note that a trend is shown only for the body weight and the body fat, body water and muscle
percentages and can be shown only when you have stored at least 5 body fat percentages etc.
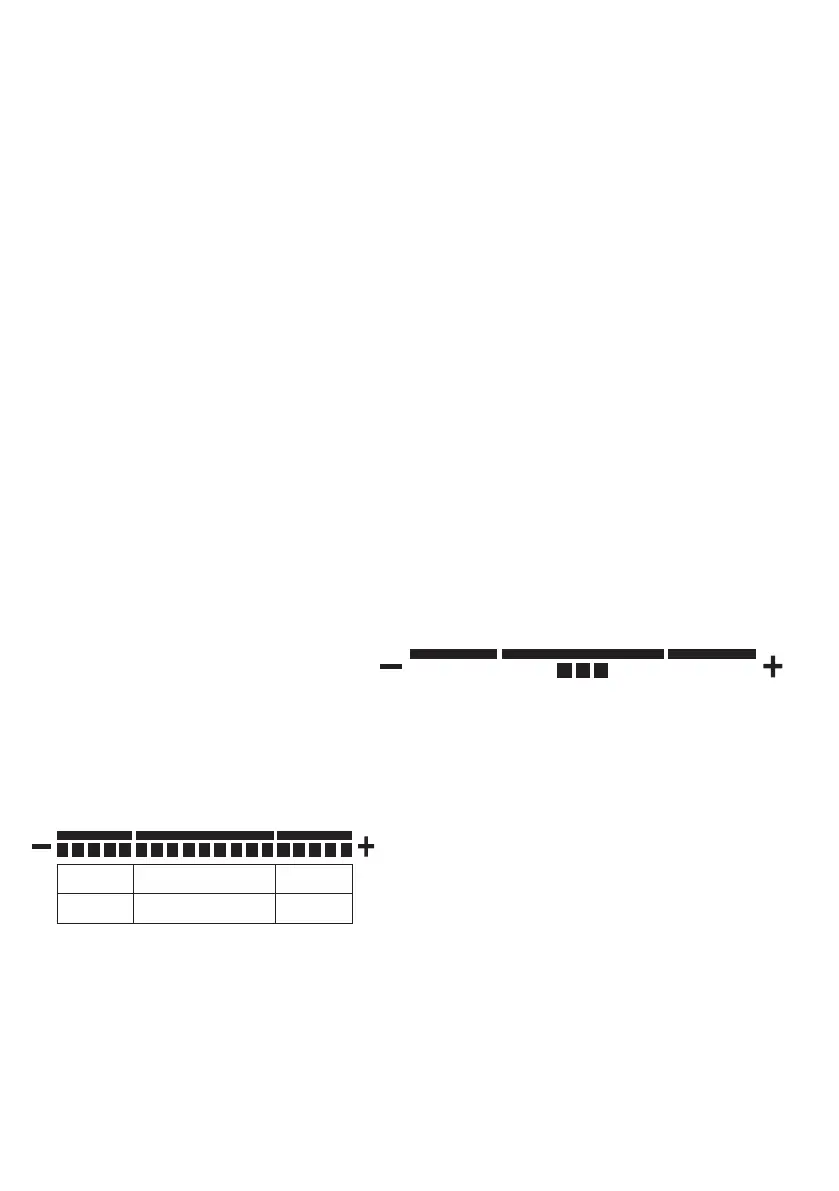
Interpretation
The weight values and the body fat, body
water and muscle percentages are inter-
preted with a bar in the evaluation graphic. When the values are low, the bar is shown to the left
(-). When the bar is in the middle area, the values are normal. While in the right-hand area (+) the
values are relatively high.
Weight:
Your weight is compared with the BMI (Body Mass Index). It is calculated using the following for-
NVMB#.*8FJHIUJOLHIFJHIUJON¤
Underweight Normal weight Overweight
<20 20-25 >25
Note that with very muscular physiques (body builders), the BMI interpretation will show over-
weight. The reason for this is that no account is taken of well above average muscle mass in the
BMI formula.