The classification is based on standards adopted from WHO (World Health Organization); which is recognized
by the Canadian Hypertension Society (CHS).
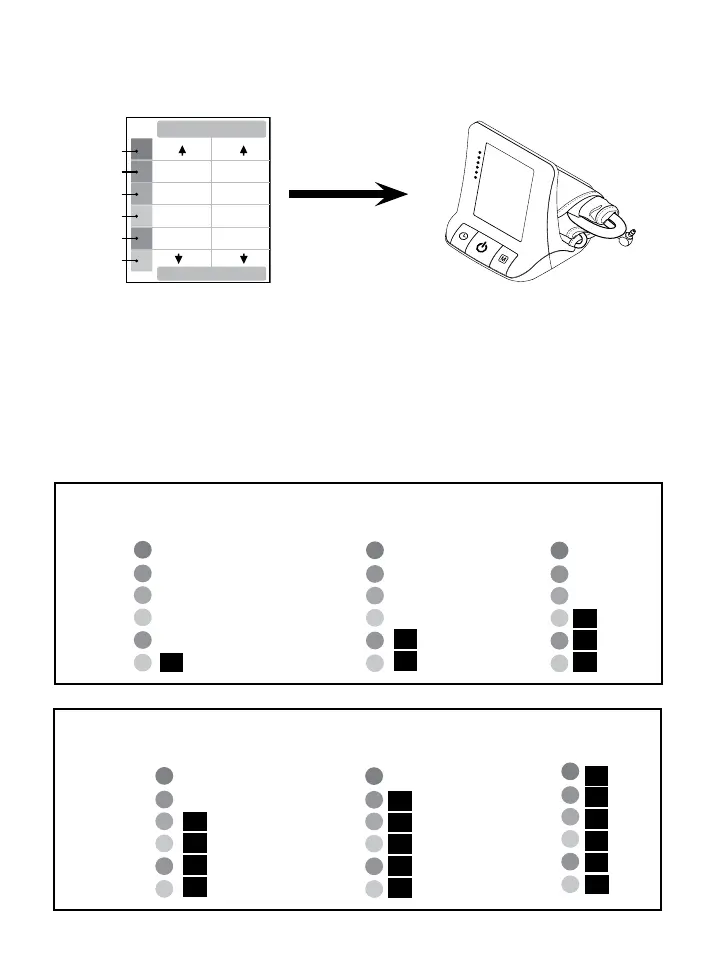
Refer to the chart below for details of the classification.
SYS
WHO World Health Organization 2003
180
160-180
110
100-110
90-100
85-90
80-85
80
140-160
130-140
120-130
120
(mmHg)
DIA
Red
Red
Orange
Yellow
Green
Green
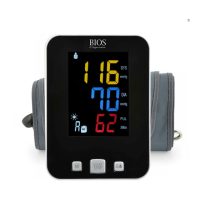
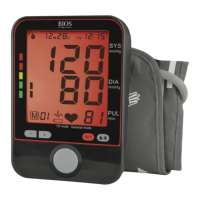
The indicator bar raises according to your measurement.
• Ifyourmeasurementhasonlyoneortwobars,yourmeasurementisinthegreenzone,or“Normal”
according to National Institute of Health (NIH) standards.
• Ifyourmeasurementhasthreebars,itisintheyellowzone,or“Pre-Hypertension”accordingtoNIH
standards, or high normal according to the WHO classification.
• Ifyourmeasurementhasfourbars,itisintheorange“Stage1Hypertension”zone.
• Ifyourmeasurementhasvebars,itisinthered“Stage2Hypertension”zone.
• Ifyourmeasurementhassixbars,itisinthered“Stage3Hypertension”zone.
Red
Red
Orange
Yellow
Green
Green
Red
Red
Orange
Yellow
Green
Green
Red
Red
Orange
Yellow
Green
Green
Indication of a
“Optimum” Blood
Pressure
Indication of a
“Normal” Blood
Pressure
Indication of “Pre-
Hypertension” Blood
Pressure
Red
Red
Orange
Yellow
Green
Green
Red
Red
Orange
Yellow
Green
Green
Red
Red
Orange
Yellow
Green
Green
Indication of a “Stage
1 Hypertension”
Blood Pressure
Indication of a “Stage
2 Hypertension” Blood
Pressure
Indication of a “Stage
3 Hypertension” Blood
Pressure