13
12/04/9516:14
NOcalibrationdue:01/01/96
NO2calibrationdue:07/01/96
NOupperalarm:15
NOloweralarm:5
NO2upperalarm:4
Patient:...............................
Hospital:...............................
Technician:...............................
5NO150NO24
1715
1730
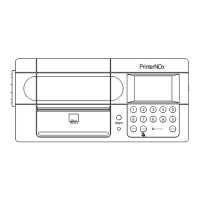
Spaces for entering the patient name or ID, hospital name, and
technician name are provided.
This is followed by the axes for the NO and NO
2
graphs.
These graphs are auto scaled to the current alarm settings.
A section of the graph will be printed once every 32 samples and
includes a time stamp every 15 minutes on the left-hand side. Each
dot on the graph represents the average of 4 measurements.