EasyManua.ls Logo

Casio CFX-9800G

Casio CFX-9800G
206 pages
To Next Page IconTo Next Page
To Previous Page IconTo Previous Page
Loading...
Box
Zoom
Function
cont'd
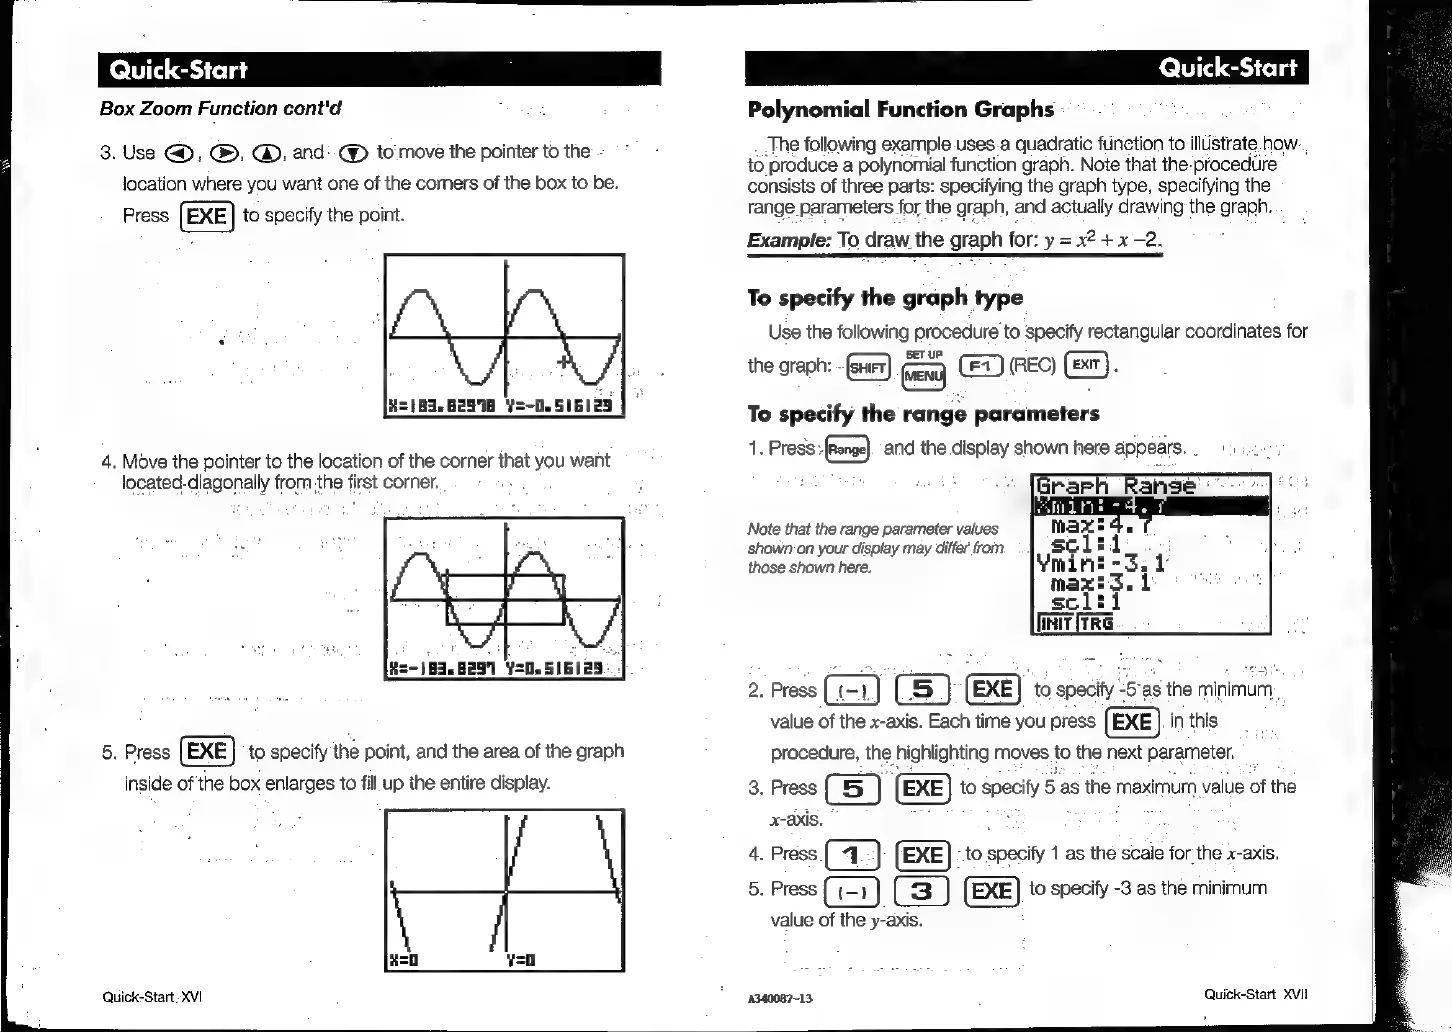
3.
Use
G&D,
®,
GW,
and:
@
to
move
the
pointer
to
the
location
where
you
want
one
of
the
corners
of
the
box
to
be.
Press
(EXE)
to
specify
the
point.
X=/B5,.829'18
Y=-0.5161
Fe
4.
Move
the
pointer
to
the
location
of
the
corner
that
you
want
located-diagonally
from
the
first
corner.
#=-1839.8297
Y=0.516125:
»
5.
Press
(EXE)
fo
specify
the
point,
and
the
area
of
the
graph
inside
of
the
box
enlarges
to
fill
up
the
entire
display.
Quick-Start
XVI
Polynomial
Function
Graphs
The
following
example
uses.a
quadratic
function
to
illustrate.how..
t0
produce
a
polynomial
function
graph.
Note
that
the-procedure
consists
of
three
parts:
specifying
the
graph
type,
specifying
the
range
parameters
for
the
graph,
and
actually
drawing
the
graph.
Example:
To
draw
the
graph
for:
y
=
x2
+
x-2.
To
specify
the
graph
type
Use
the
following
procedure
to
specify
rectangular
coordinates
for
the
graph:
-
{s+rr)
feng
(£7)
(REC)
(=x).
To
specify
the
range
parameters
A
Press
(Range)
and
the
display
shown
here
appears.
ii)
Note
that
the
range
parameter
values
shown
on
your
display
may
differ
from.
those
shown
here.
init irre
2.
Press
C=)
(5
}
(EXE)
to
specify
“Sas
the
minimum
;
value
of
the
x-axis.
Each
time
you
press
(EXE).
in
this
procedure,
the
highlighting
moves
to
the
next
parameter.
3.
Press
(5)
(Be)
to
ey
5
as
the
maximurn
value
of
the
x-axis,
4.
Press
(41-)
(4)
(EXE)
to
pacify)
1
as
the
scale
for
the
x-axis.
5.
Press
(i) (3)
(EXE)
to
specify
-3
as
the
minimum
value
of
the
y-axis.
4340087~13
Quick-Start
XVII

Related product manuals