EasyManua.ls Logo

Casio CFX-9800G

Casio CFX-9800G
206 pages
To Next Page IconTo Next Page
To Previous Page IconTo Previous Page
Loading...
To
specify
the
range
parameters
cont'd
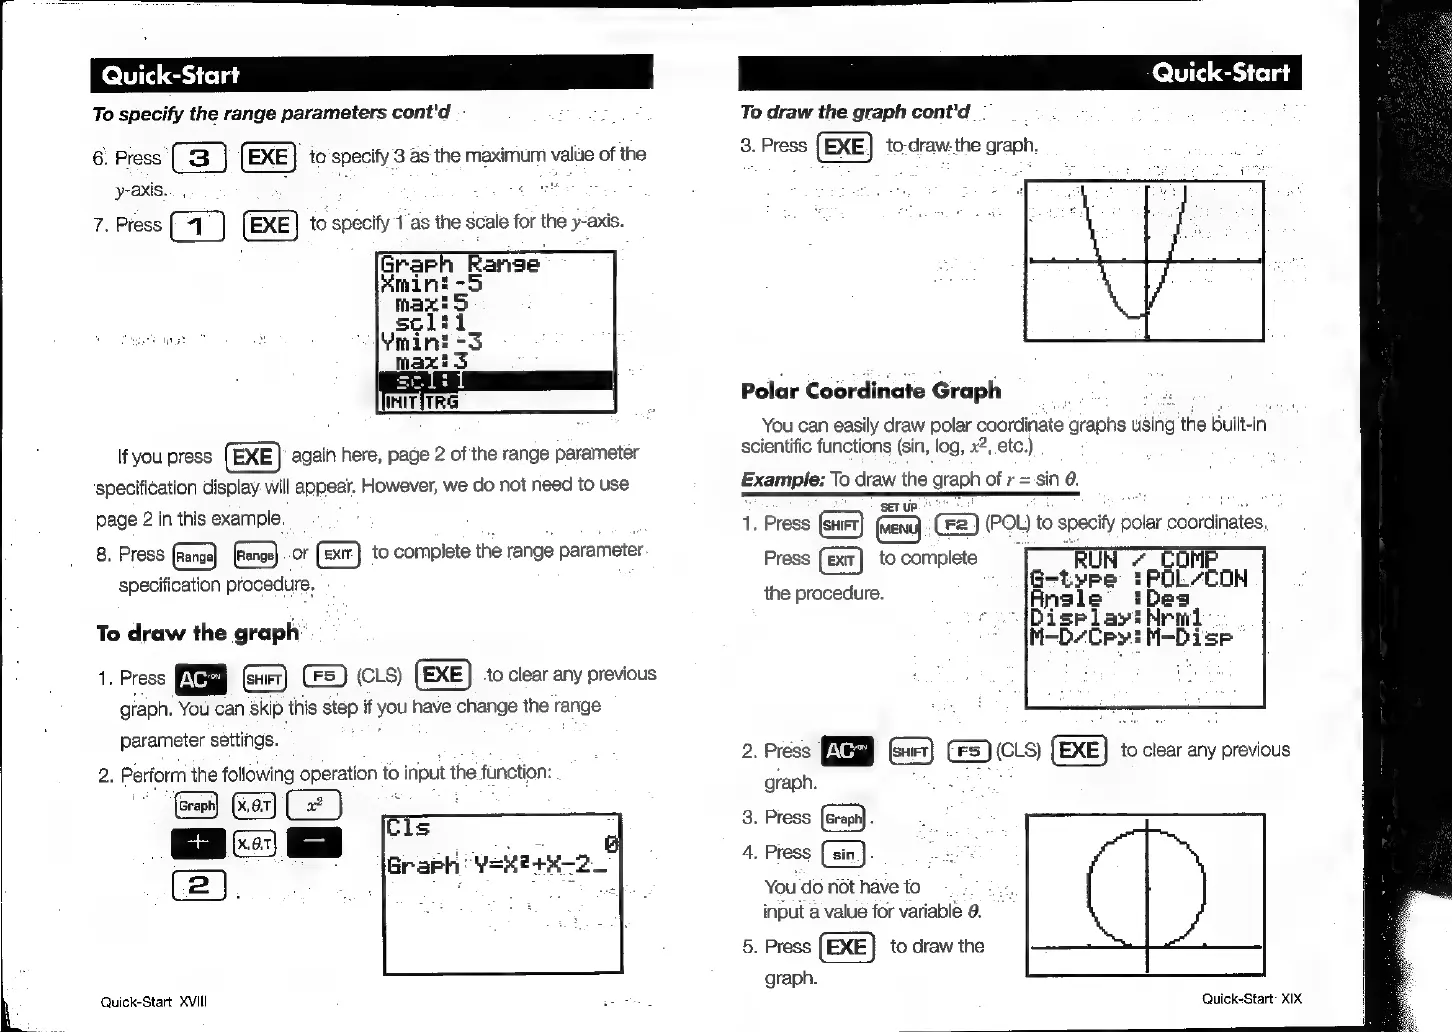
6.
Press
(3
}
(EXE)
to'specify
3
as
the
maximum
value
of
the
y-axis...
i
7
.
ao
7.
Press
(EXE]
to
specify
4/as
the
scale
for
the
y-axis.
Grarh
Ranse
If
you
press
(EXE)
again
here,
page
2
of
the
range
parameter
specification
display
will
appear.
However,
we
do
not
need
to
use
page
2
in
this
example.
8.
Press
or
to
complete
the
range
parameter
specification
procedure,
To
draw
the
graph:
.
Press
(Ger)
(eur)
CES)
(CLS)
(EXE)
to
clear
any
previous
graph.
You
can
skip
this
step
if
ag
have
change
the
range
=
parameter
settings.
2.
Perform
the
following
operation
to
input
the
function:
Quick-Start
XVIII
To
draw
the
graph
cont'd
. :
:
3.
Press
(EXE)
to-draw:
the
graph.
Polar
Coordinate
Graph
You
can
easily
draw
polar
coordinate
graphs
using
the
built-in
scientific
functions
(sin,
log,
x?,
etc.)
Example:
To
draw
the
graph
of
r=sin
0.
.
Press
(SFr)
fren
(F2)
(
(POL)
to
specity
sla
coordinates,
Press
to
complete
=
RUN
7
COMP
the
procedure.
eeire
|
POL“CON
nN
.
Press
(ews)
rae
(Fs
)
(CLS)
eae
to
clear
any
previous
graph.
Press
(Grepi)
.
Press
(sin
}.
You
do
not
have
to
input
a
value
for
variable
@.
Press
(EXE}
to
draw
the
graph.
ed
o
Quick-Start
XIX

Related product manuals