EasyManua.ls Logo

Casio CFX-9800G

Casio CFX-9800G
206 pages
To Next Page IconTo Next Page
To Previous Page IconTo Previous Page
Loading...
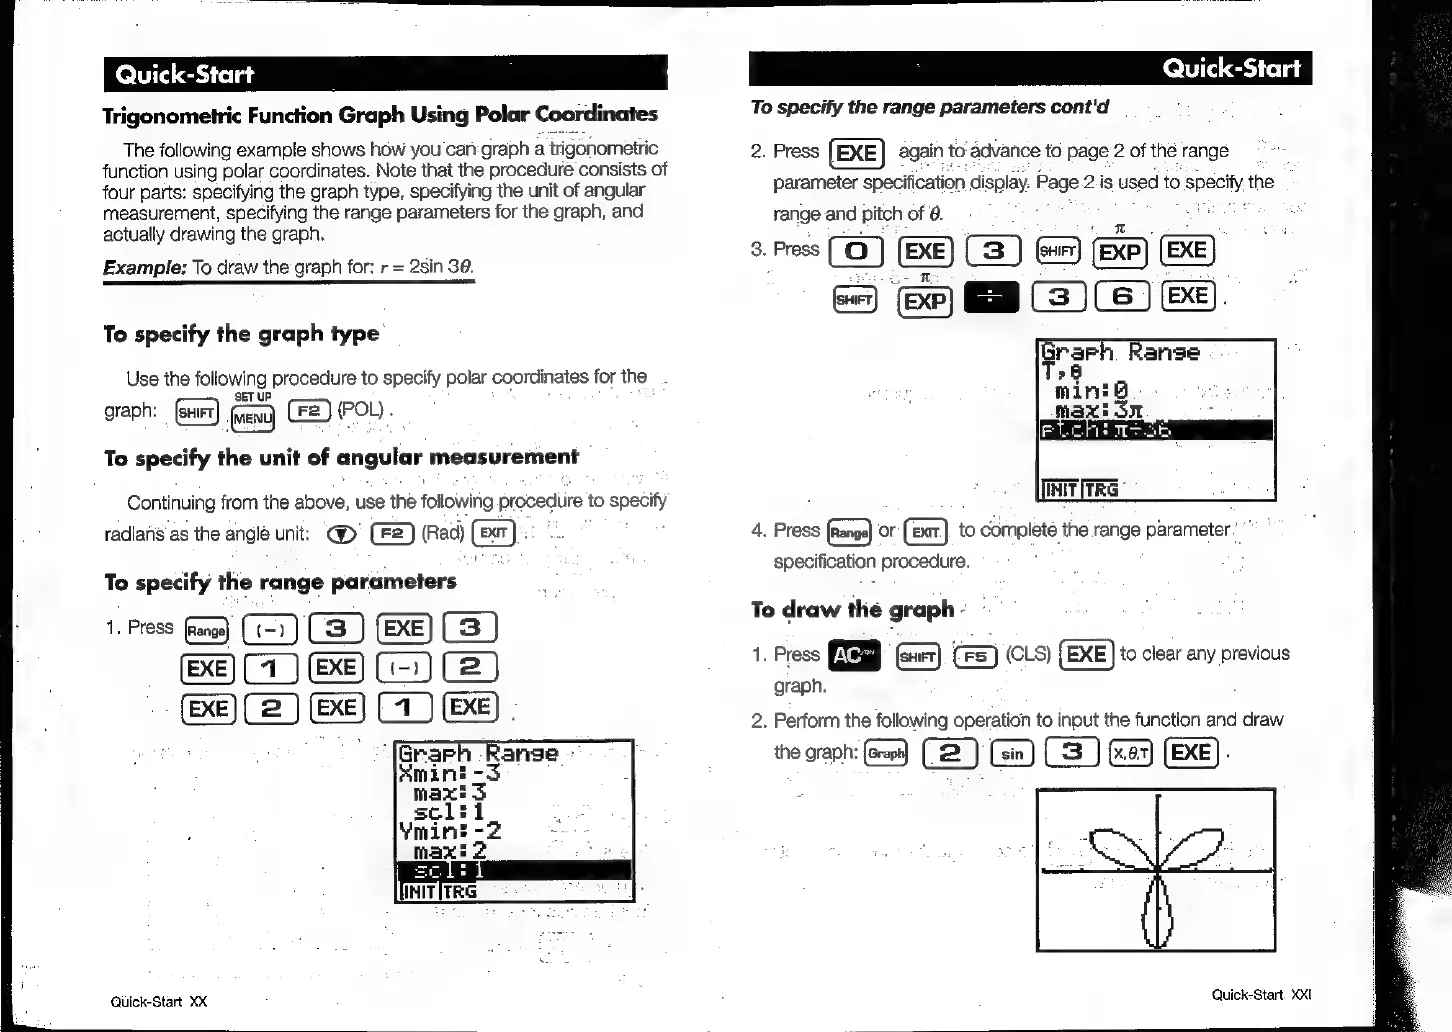
Trigonometric
Function
Graph
Using
Polar
Coordinates
The
following
example
shows
how
you
can:graph
a
trigonometric
function
using
polar
coordinates.
Note
that
the
procedure
consists
of
four
parts:
specifying
the
graph
type,
specifying
the
unit
of
angular
measurement,
specifying
the
range
parameters
for
the
graph,
and
actually
drawing
the
graph.
Example:
To
draw
the
graph
for:
r
=
2sin
39.
To
specify
the
graph
type’
Use
the
following.
procedure
to
specify
polar
coordinates
for
the
graph:
FT)
fos)
(F2)
POL).
To
specify
the
unit
of
angular
measurement
Continuing
from
the
above,
use
the
following
procedure
to
specify
radiaris
as
the
angle
unit:
@'
(F2)
(Rad)
as
To
specify
the
range
parameters
1.
Press
fans)
(1-1)
(3)
(Exe)
C3
J
(xe)
41)
©)
be)
(2)
Ge)
(
Quick-Start
XX
To
specify
the
range
parameters
cont'd
2.
Press
(EXE)
again
to
advance
to
page
:
2
of
the
range
parameter
specification
display.
Page
2is
used
to
specify,
the
range
and
pitch
of
@.
sro
(0) Se) (B)
6
Be)
BH
=)
6)
EE
)6)
Ge)
graph
Range
?
ming
-
4.
Press
or
to
completé
the
range
parameter
specification
procedure.
To
draw
the
graph
1.
Press
(CLS)
(EXE)
to
clear
any
previous
graph.
2.
Perform
the
following
operation
to
input
the
function
and
draw
torn
Ga)
CE)
(am)
()
Oa)
(EXE):
We
()
Quick-Start.
XXI

Related product manuals