136
kk
kk
k Graph Range Adjustment Function
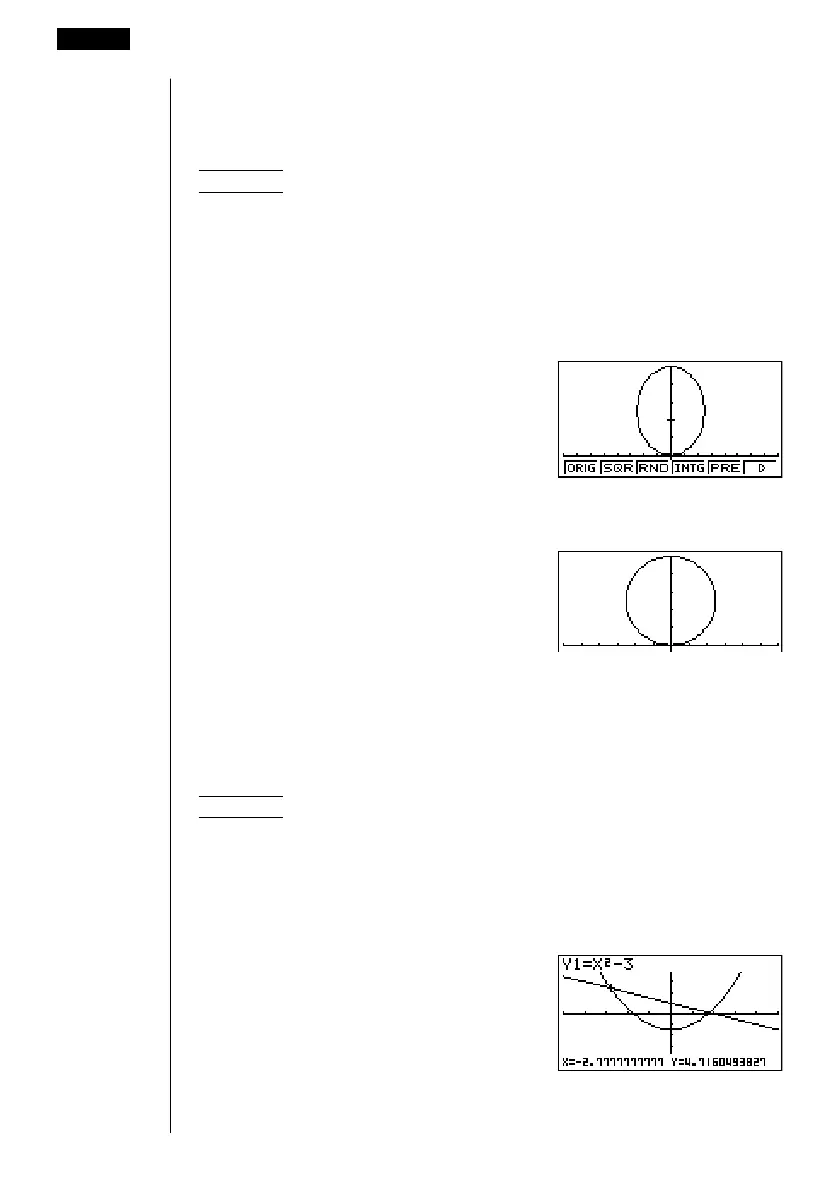
[Zoom]-[SQR]
This function makes the View Window
x-range value the same as the y-range
value. It is helpful when drawing circular graphs.
Example To graph r = 5sin
θ
and then adjust the graph.
Use the following View Window parameters.
Xmin = –8 Ymin = –1
Xmax = 8 Ymax = 5
Xscale = 1 Yscale = 1
1. After drawing the graph, press 2 (Zoom) 6 (g).
2. Press 2 (SQR) to make the graph a circle.
kk
kk
k Coordinate Rounding Function [Zoom]-[RND]
This feature rounds the coordinate values at the pointer location to the optimum
number of significant digits. Rounding coordinates is useful when using trace and
plot.
Example To round the coordinates at the points of intersection of the
two graphs drawn on page 128
Use the same View Window parameters as in the example on page
128.
1. After graphing the functions, press 1 (Trace) and move the pointer to the first
intersection.
8 - 6 Other Graphing Functions
1 2 3456

 Loading...


