EasyManuals Logo

Casio fx-9750GII Quick Reference Guide

Casio fx-9750GII
16 pages
To Next Page IconTo Next Page
To Previous Page IconTo Previous Page
Page #11 background imageLoading...
Page #11 background image
8. To see a scatter-plot of these data, you can go through and change GPH 1 back, using the
process above, or select w (GPH 2) from the List Editor screen whose default is also a
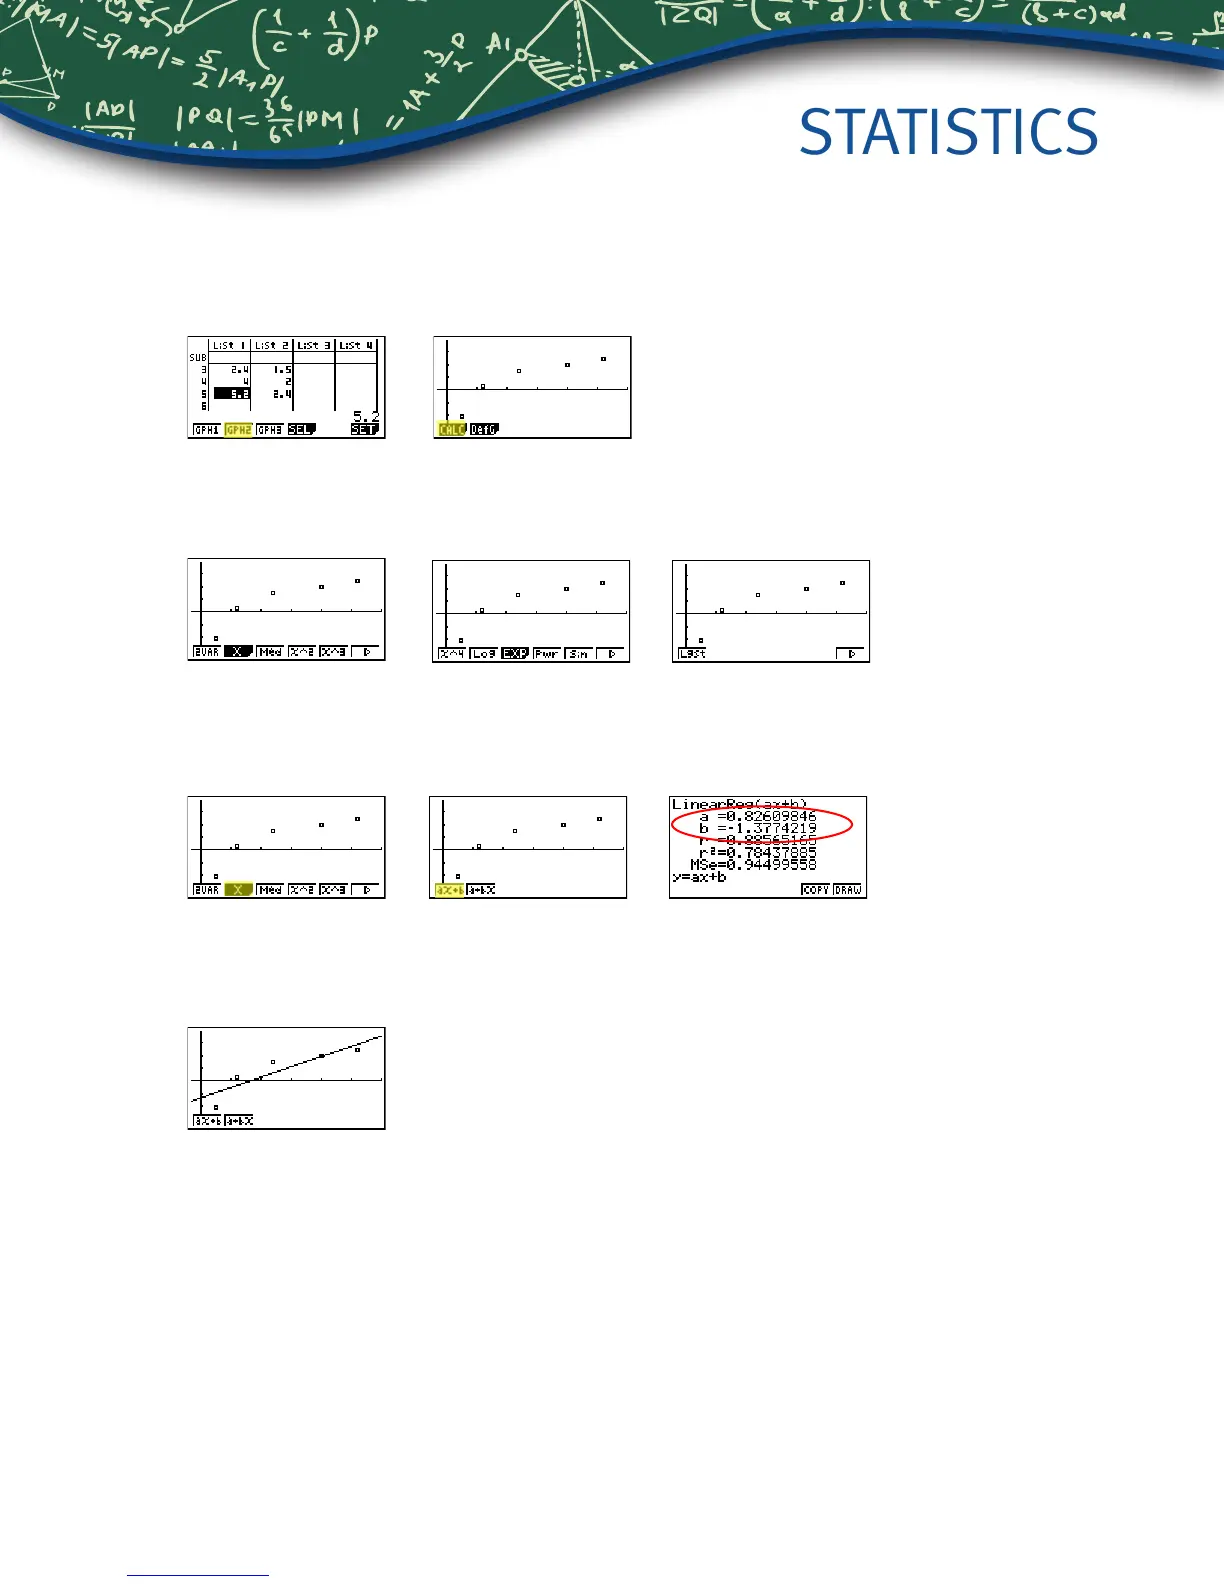
scatter-plot.
9. From the scatter-plot screen, pressing q will show all the calculations that can be obtained
from this set of data.
10. To calculate a linear regression for these data, select w from the rst set of options and then
press w for the preferred form. For this example, we will use y = ax + b.
11. From this screen, select y (COPY) to copy and then paste the regression equation into the
initial Graph screen or select u (DRAW) to show the linear regression.
STATISTICS
Getting Started with the fx-9750GII
11

Other manuals for Casio fx-9750GII

Questions and Answers:

Question and Answer IconNeed help?

Do you have a question about the Casio fx-9750GII and is the answer not in the manual?

Casio fx-9750GII Specifications

General IconGeneral
TypeGraphing
Cover-
Form factorDesktop
Control typeButtons
Product colorBlue
Digits- digits
Display tiltingNo
Display resolution64 x 128 pixels
Display number of lines8 lines
Display number of characters21
Battery typeAAA
Power sourceBattery
Auto power offYes
Number of batteries supported4
Flash memory0.061 MB
Storage media typeFlash
Symbolic notationSquare root
Conversion betweenDecimal, Percent
Weight and Dimensions IconWeight and Dimensions
Depth180.5 mm
Width87.5 mm
Height21.3 mm
Weight205 g

Related product manuals