PICTURE
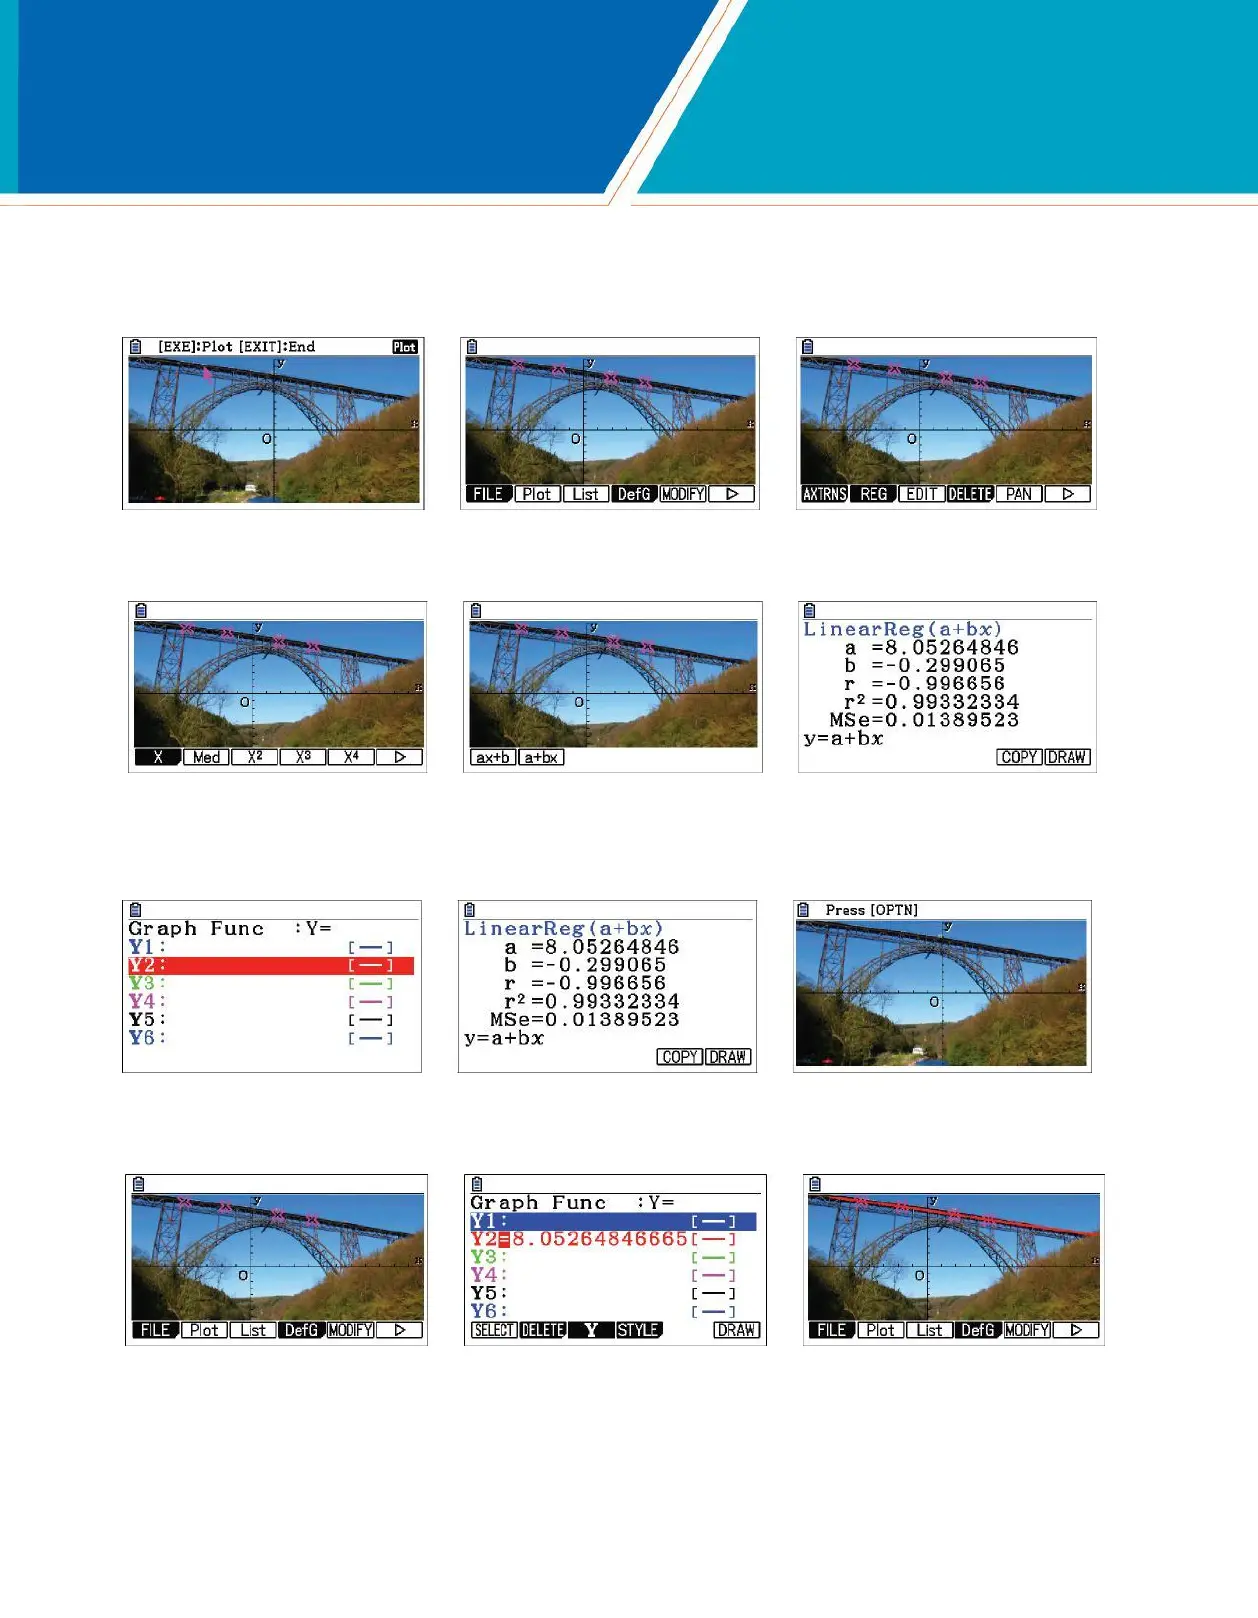
PLOT
Use the direction wheel to move the arrow to a point on the line. Press l to mark the point. Continue to mark several additional points. When done,
press d. To perform a regression, press u () w(REG).
For linear regression, press q(X) and select either form. Here, w(a+bx) is used.
To save the result, press y(COPY). The display is improved if the graph is not blue, so scroll to Y2 and press l. Press (DRAW) to view the equation of the line. The
graph is drawn but as a thin blue line.
To draw the graph that was saved, press ir(DefG)u(DRAW).
fx-CG50 Quick Start Guide 25

 Loading...


