Using the Graph Function in Programs
Using the graph function within programs makes it possible to graphically represent
long, complex equations and to overwrite graphs repeatedly. All graph commands
(except the trace function) can be included in programs. Range values can also
be written into the program.
Generally, manual graph operations can be used in programs without modification.
Graphically determine the number of solutions (real roots) that
satisfy both of the following two equations.
Example 1
>>= 10jc- 30
The range values are as follows.
Xmin
Xmax
Xscl
10
10
2
Ymin
Ymax
Yscl
-120
150
50
First, program the range setting. Note that values are separated from each other
by commas“ »” .
Range, (-), 1, 0, >,1, 0, >, 2, ’ , (-), 1, 2, 0, ’ , 1, 5, 0, ’ , 5, 0
Next, program the equation for the first graph.
Graph, X, 4, - , X, 3, - , 2, 4, X, * 2, +, 4, X, +, 8, 0
Finally program the equation for the second graph.
Graph, 1, 0, X, - , 3, 0 Total 49 steps
When inputting this program, press CD after input of the ranges and the first
equation.
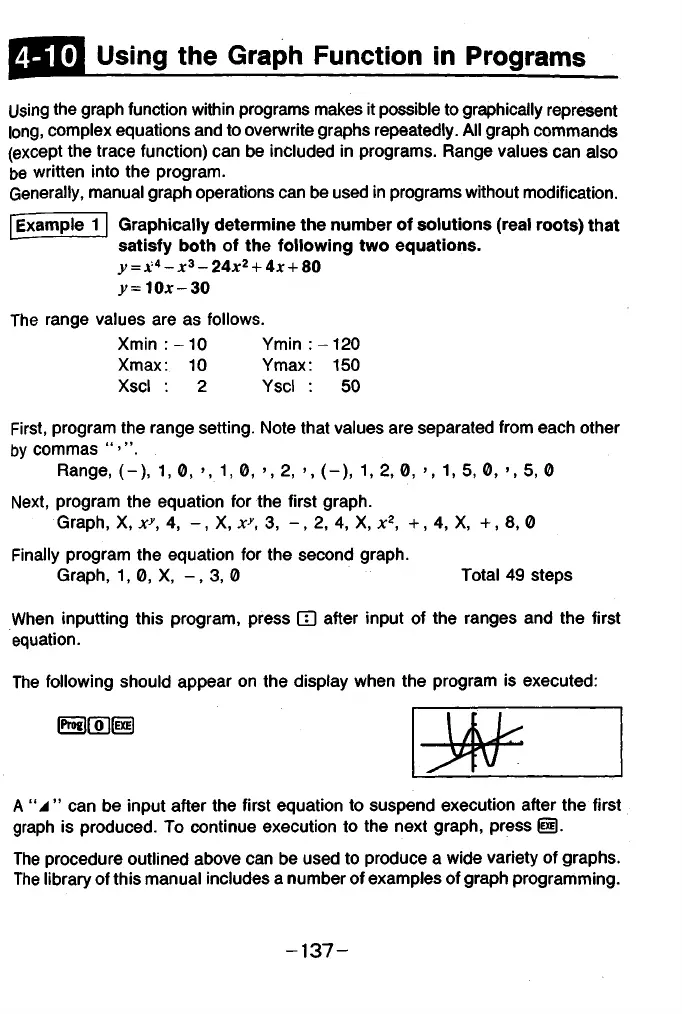
The following should appear on the display when the program is executed:
ra ro iiixii
A “ J ” can be input after the first equation to suspend execution after the first
graph is produced. To continue execution to the next graph, press
The procedure outlined above can be used to produce a wide variety of graphs.
The library of this manual includes a number of examples of graph programming.
- 1 3 7 -