Chord Electronics
Mojo 2 | User manual
16
All headphones will have their own frequency response curve, deviating from the ideal. The website RTINGs.
com (https://www.rtings.com/headphones/1-4/graph/) lists the frequency response curves of many popular
headphones and can be used as a guide for experimentation with Mojo 2’s DSP feature. DSP can be used to
flatten the response curve for a more neutral sound.
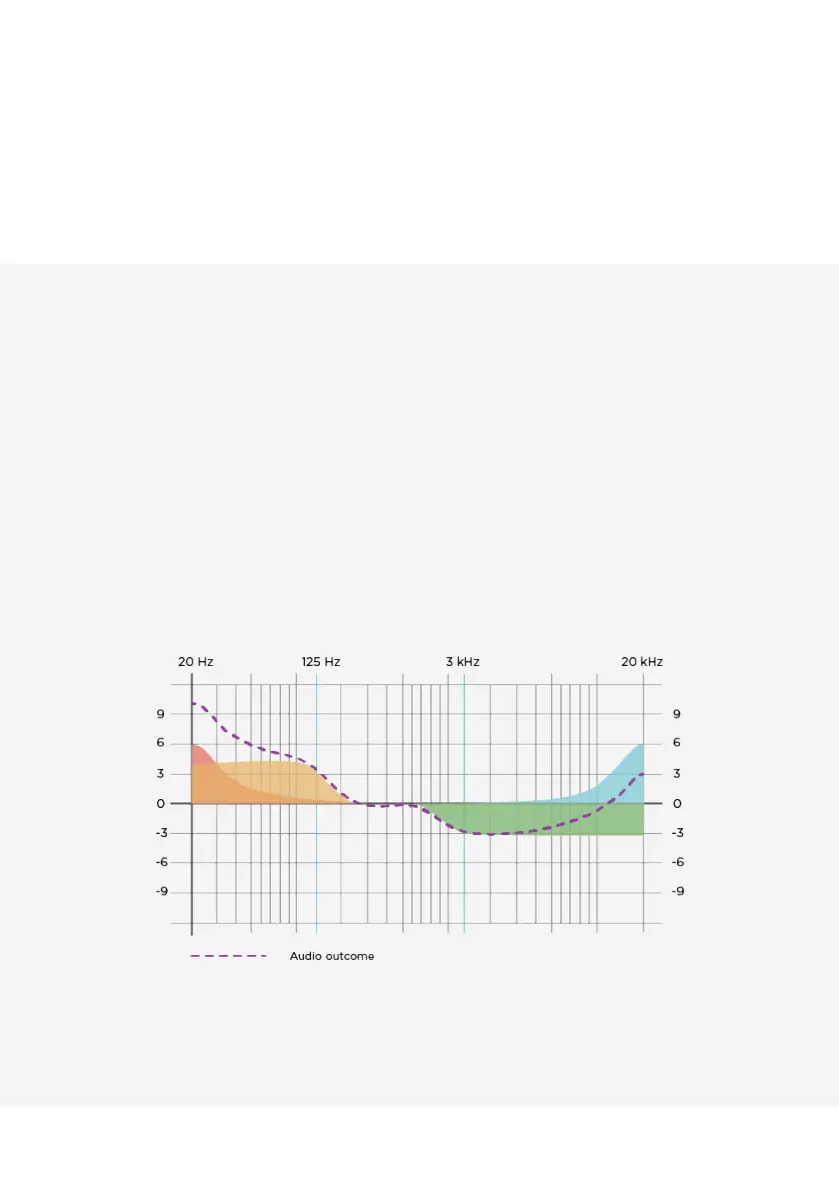
The dotted line seen in Graph 2 shows a frequency response curve: a wavy line with peaks and troughs, that
has been altered by Mojo 2’s DSP.
The four colours show how the DSP’s equalisation tone controls have been used to change the summed output
(dotted line). The bass and mid bass have been boosted, the low mid has been reduced, and the treble has
been boosted, changing the frequency response (tone) of the device.
Graph 2