C.I.B. UNIGAS - M03965CE
7
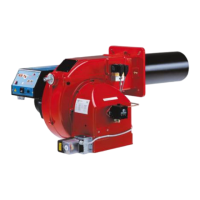
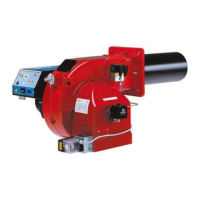
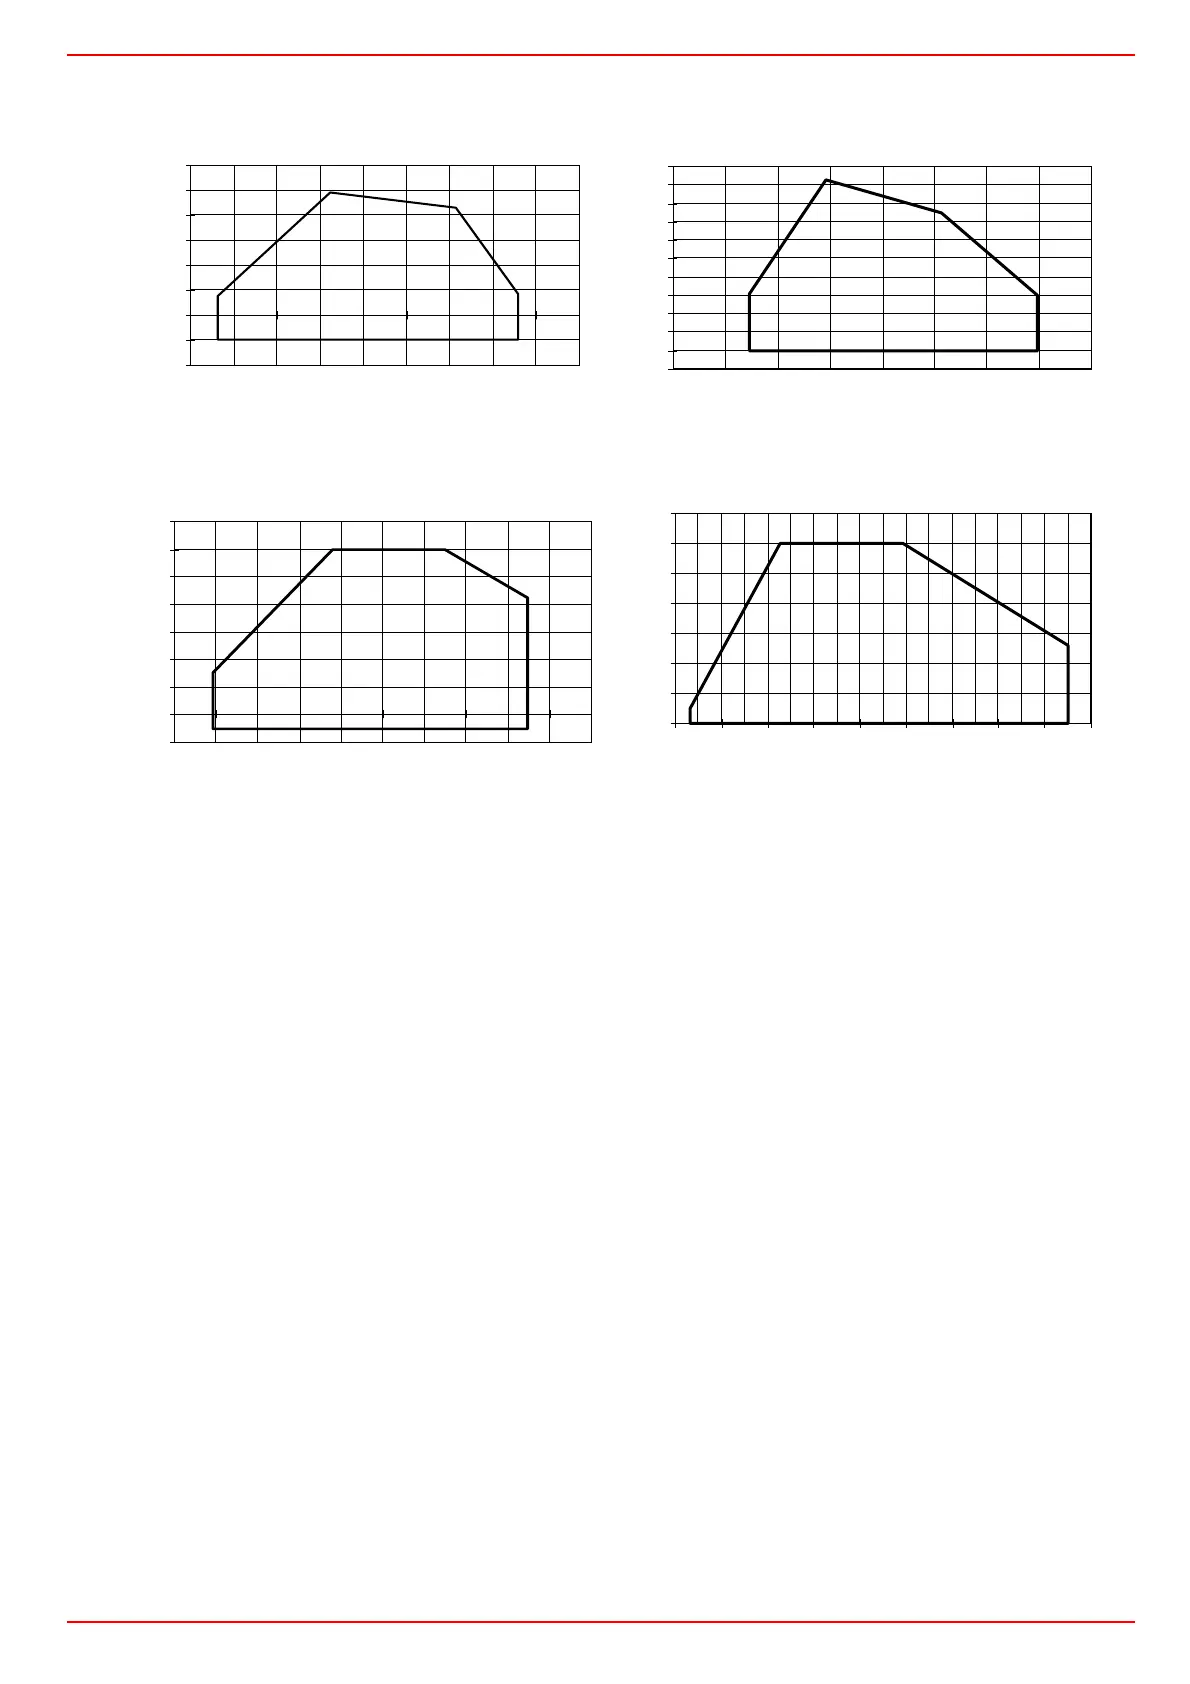
Performance curves
To get the input in kcal/h, multiply value in kW by 860.
Data are referred to standard conditions: atmospheric pressure at 1013mbar, ambient temperature at 15°C
NOTE: The performance curve is a diagram that represents the burner performance in the type approval phase or in the laboratory
tests, but does not represent the regulation range of the machine. On this diagram the maximum output point is usually reached by adj-
suting the combustion head to its “MAX” position (see paragraph “Adjusting the combustion head”); the minimum output point is rea-
ched setting the combustion head to its “MIN” position. During the first ignition, the combustion head is set in order to find a
compromise between the burner output and the generator specifications, that is why the minimum output may be different from the Per-
formance curve minimum.
BACK PRESSURE IN
COMBUSTION CHAMBER mbar
PG30
kW
PG60
kW
BACK PRESSURE IN
COMBUSTION CHAMBER mbar
PG70
kW
PG81
kW
-2
-1
0
1
2
3
4
5
6
80 120 160 200 240 280 320 360 400 440
-2
-1
0
1
2
3
4
5
6
7
8
9
0 100 200 300 400 500 600 700 800
-2
0
2
4
6
8
10
12
14
200 300 400 500 600 700 800 900 1000 1100 1200
0
2
4
6
8
10
12
14
200 400 600 800 1000 1200 1400 1600 1800 2000
 Loading...