P.4
Incidentally. . .
Because of stray inductance and capacitance, it is possible for the meter to show a “quasi” reson
ant frequency. If the measured “resonant” frequency is different from what you expected, inspect
your system for these possible issues, in addition to those mentioned previously.
◆
Using the Graph Mode to Display SWR vs. Frequency
There are two types of Graph mode on this meter. You may use a predetermined center frequency and
bandwidth to perform an SWR sweep, and alternately you may set an arbitrary center frequency and bandwidth
to perform a manual SWRsweep.
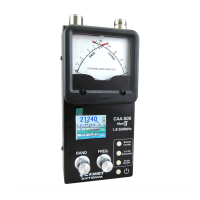
Auto Sweep Mode
(“SWR” caption around center of Graph shown in Red
)
1
.
While in the Normal display mode, press the SWEEP/CENTER button to initiate
an automatic sweep. The center frequency and sweep bandwidth will be based on
the Band that is currently selected.
2
.
While the Sweep is in progress, the “SWR” caption will blink. A band Sweep
typically takes about 25 seconds to complete.
3
.
Once the Sweep is completed, you may repeat the Sweep as many times as
desired by just pressing the SWEEP/CENTERbutton again.
4
.
To return to the Normal Mode, press the GRAPH ON/OFF button. Note that the
FREQ and BAND knobs are disabled in the Sweep Mode.
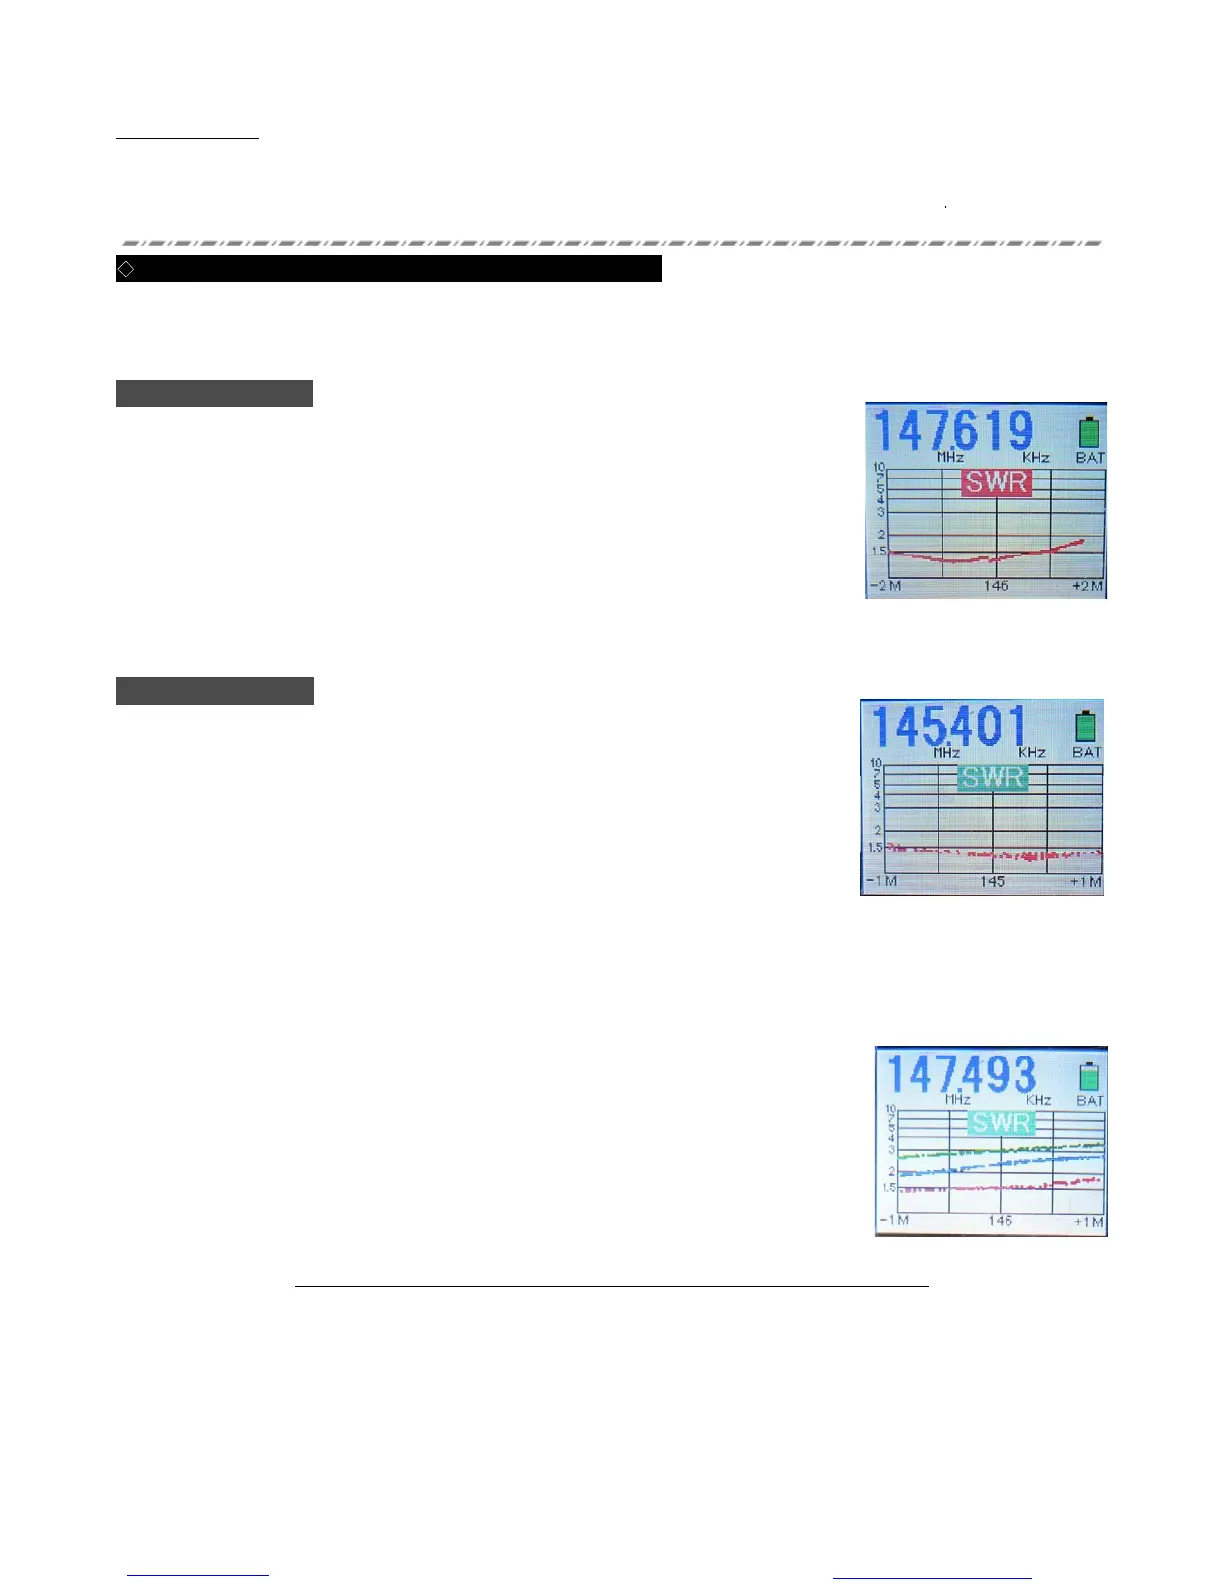
Manual Plot Mode
(“SWR” caption around center of Graph shown in Green)
1
.
While in the Normal display mode, press the GRAPH ON/OFF button to enter
the Manual Plot mode. A green “SWR” box will appear.
2
. The SWR Graph will now be displayed; use the BAND and FREQ knobs to set the
desired center frequency for the manual SWRSweep.
3
. Press the SWEEP/CENTER button.
The center frequency (rounded to three digits) will appear in the center of the
Graph, and the Sweep Limits (left and right at bottom) will blink.
4
.
Use the BAND and/or FREQ knobs to set the Sweep bandwidth, then press the
A.P.OFF button to confirm the setting.
・
Because the BAND knob causes huge frequency shift, generally you will use the FREQ
knob to set Sweep Limits.
5
.
After the setup is finalized, rotate the FREQ knob to perform the Manual Sweep. Gradual rotation of the FREQ knob
allows precision measuring to be performed (minimum resolution 1 kHz).
6
.
If you press the AP-OFF button during a Manual Sweep, the color of the plot will
change (Red -> Blue -> Green -> Purple -> Orange -> Red. . .).
7
.
If you want to change the bandwidth in this mode, press the SWEEEP/CENTER button
again.
8
.
To return to the Normal mode, press the GRAPH ON/OFFbutton.
Note: You can not preserve the Graph data if you change Graph Modes
Auto Sweep Mode
Manual Plot Mode
You created this PDF from an application that is not licensed to print to novaPDF printer (http://www.novapdf.com)
 Loading...