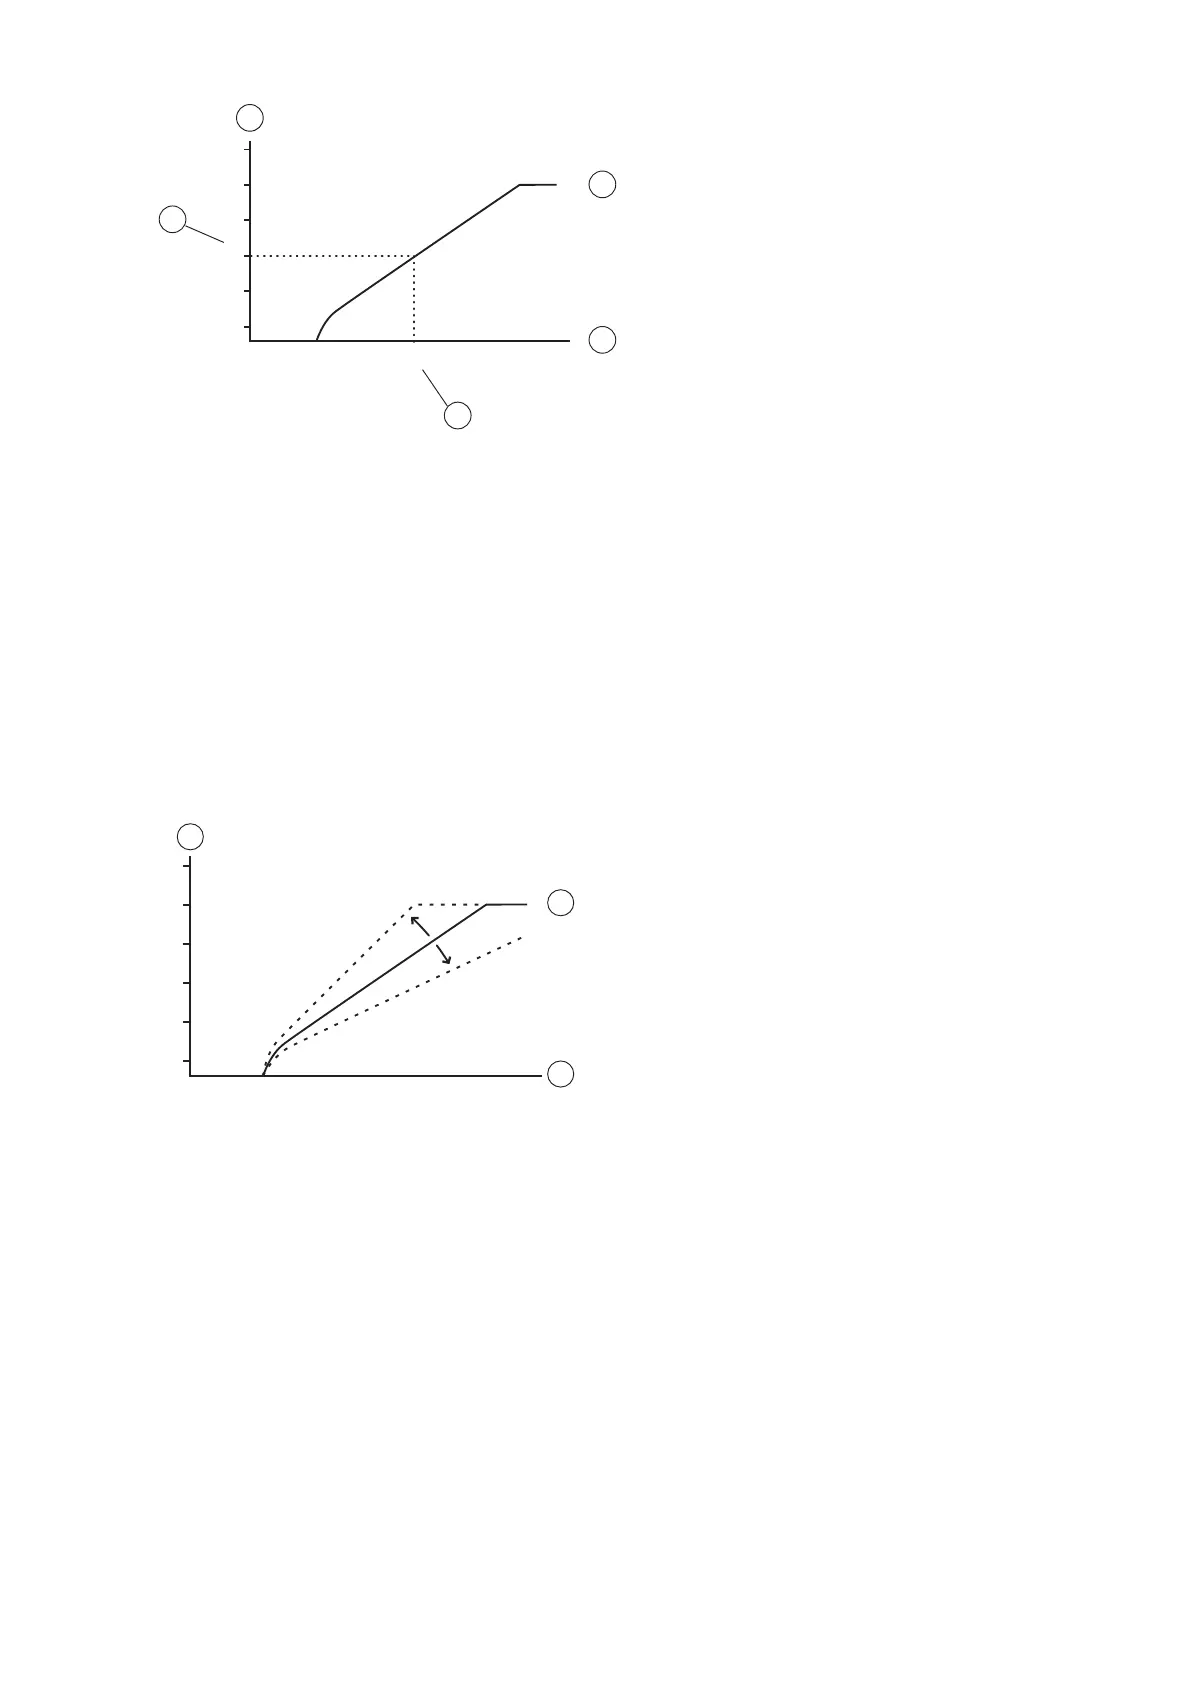
Figure 1. Graph showing the set value 40 for CURVE.
Position Description
1 Supply temperature (°C)
2 Maximum supply temperature
3 Outdoor temperature (°C)
4 0°C
5 Value for CURVE is 40°C
In the event of outdoor temperatures below 0°C, a higher setpoint value is calculated and in the event of outdoor
temperatures greater than 0°C, a lower setpoint value is calculated.
Figure 2. Increasing or reducing the CURVE changes the slope of the curve.
Position Description
1 Supply temperature (°C)
2 Maximum supply temperature
3 Outdoor temperature (°C)
If the CURVE value is increased, the heat curve will become steeper and if the value is reduced, it will become flat-
ter.
The most energy efficient and cost effective setting is achieved by changing the CURVE value to adjust the tem-
perature in the house to an even and constant temperature. For a temporary increase or reduction, adjust the
ROOM value instead.
40 – Installation instructions VMGFD102
 Loading...