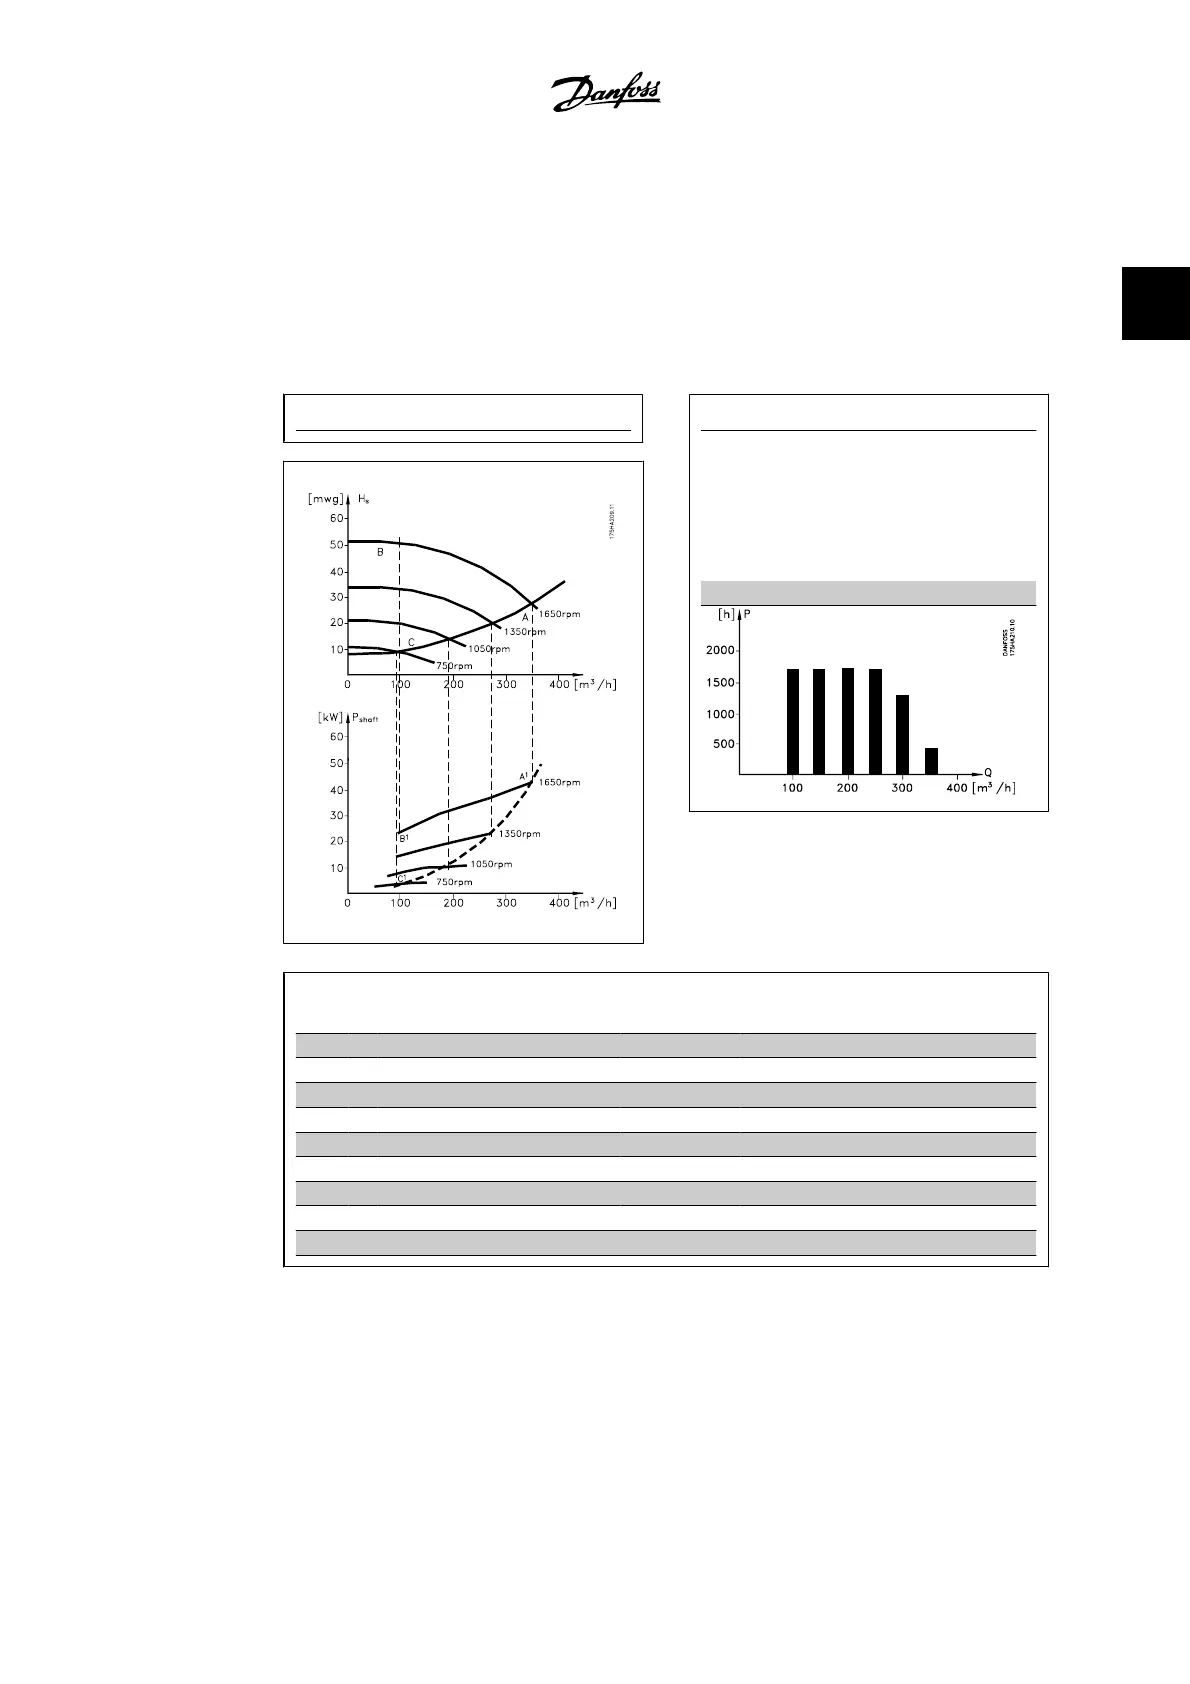
2.6.4. Example with varying flow over 1 year
The example below is calculated on the basis of pump characteristics obtained from a pump da-
tasheet.
The result obtained shows energy savings in excess of 50% at the given flow distribution over a
year. The pay back period depends on the price per kwh and the price of the adjustable frequency
drive. In this example, it is less than a year when compared with valves and constant speed.
Pump characteristics
Energy savings
P
shaft
=P
shaft output
Flow distribution over 1 year
m
3
/h
Distribution Valve regulation Adjustable frequency drive
control
% Hours Power Consumption Power Consumption
A
1
- B
1
kWh A
1
- C
1
kWh
350 5 438 42,5 18.615 42,5 18.615
300 15 1314 38,5 50.589 29,0 38.106
250 20 1752 35,0 61.320 18,5 32.412
200 20 1752 31,5 55.188 11,5 20.148
150 20 1752 28,0 49.056 6,5 11.388
100 20 1752 23,0 40.296 3,5 6.132
Σ 100 8760 275.064 26.801
VLT
®
HVAC Drive Design Guide 2. Introduction to the VLT HVAC Drive
MG.11.B4.22 - VLT
®
is a registered Danfoss trademark.
21
2
 Loading...