1.2 Fiber Photometry Console
This FPGA based data acquisition unit synchronizes the output control and the acquisition of the input data. This device
seamlessly integrates with Doric Neuroscience Studio software, which provides the user-interface for multi-channel
photometry experiments.
The software interface enables control over the CW excitation light pulses, square or sinusoidal waveform of an ex-
ternal source (i.e. LED driver) with 4 digital input/outputs and 4 analog voltage outputs. The software interface displays
real-time data of up to 4 detectors input signals and performs data acquisition. The other new functionalities are being
developed and users can upload them as they become available.
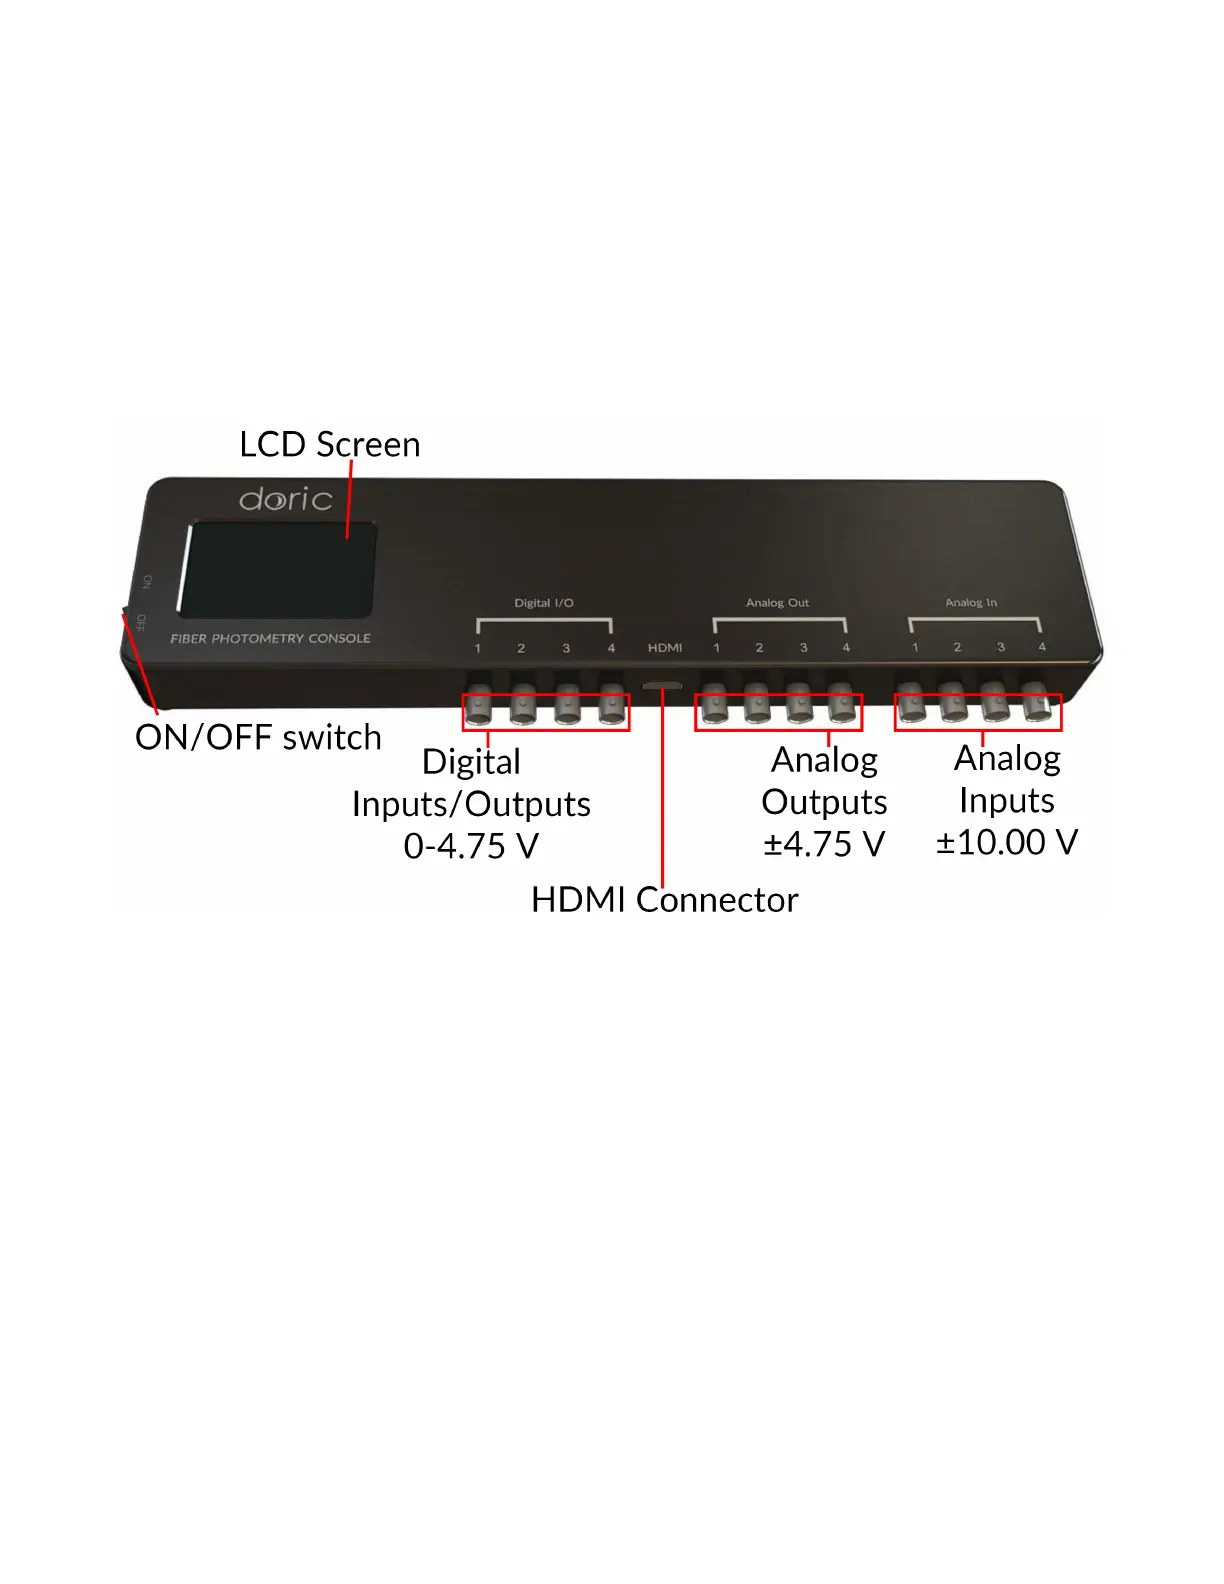
The Fiber Photometry Console inputs and outputs are shown in figures 1.2 and 1.3.
Figure 1.2: Front view of the Fiber Photometry Console: Inputs and outputs
• The LCD Screen displays console information.
• The Digital/IO ports sends 0-4.75 V TTL pulses.
• The HDMI port acquires digital signals and digital communication SPI and LVDS via a custom pinout HDMI con-
nector.
• The Analog-out ports send a variable ± 4.75 V analog signal signal.
• The Analog-in ports acquire analog signals up to ±10 V.
• The Power On/Off opens and closes the device.
Chapter 1. Fiber Photometry Systems at a Glance 5
 Loading...