11
The circuits that make up the DORROUGH Loudness Monitor (and Relative
Loudness to Peak Modulation meter) are grouped onto two circuit boards:
an Input Signal Processing Board (including Power Supply), and a Bar and
Peak Driver Circuit Board.
NOTE: On Panel Type Meters, the Power Supply is a separate circuit board.
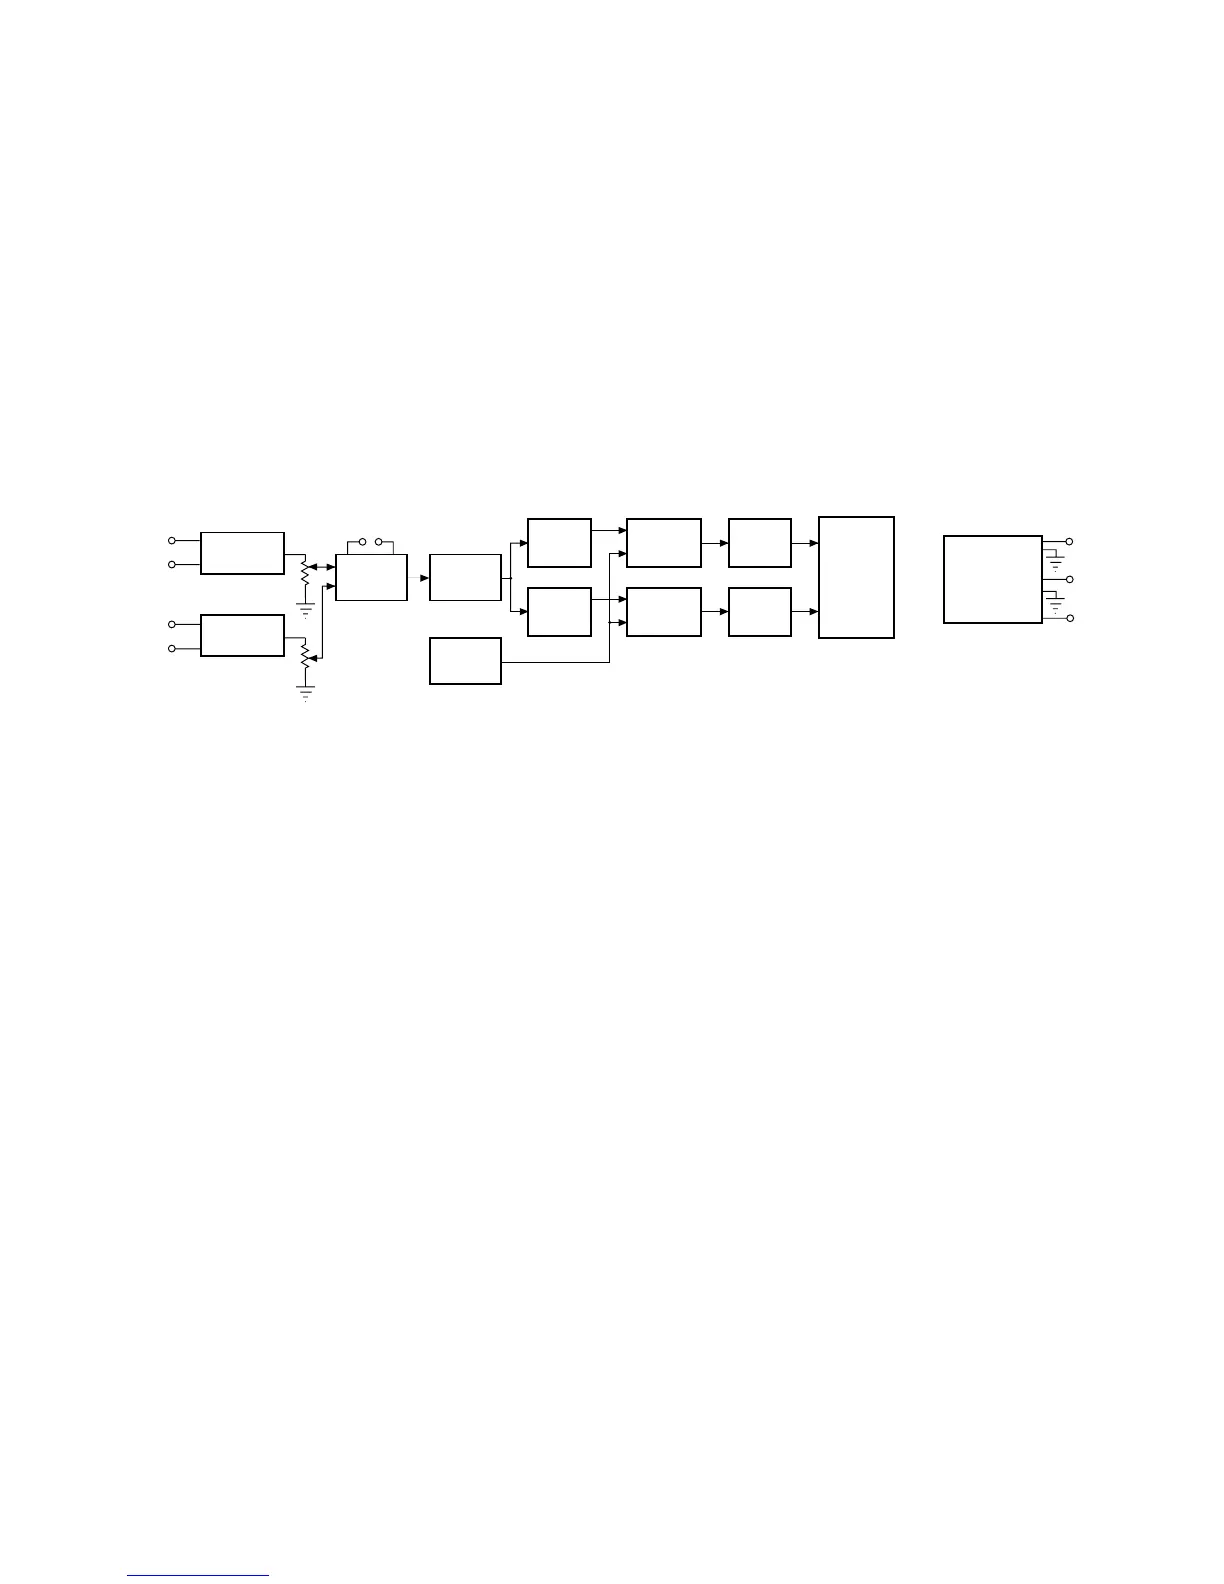
A block diagram, shown in Fig. 14, discloses the circuit elements and connec-
tions in a simplified form. Refer to this diagram, as well as the circuit
schematics (back of manual), throughout the following discussion.
The input is fed into the left and right differential amplifiers. The differential
inputs are configured so that the input impedance is 20K for balanced inputs
and 10K for unbalanced inputs (negative terminal is grounded for unbal-
anced operation).
The left input level is controlled by R-13 and the right input by R-14. The
output of these two controls are fed to a summing amplifier. The feedback
resistor R-18 controls the input sensitivity of the instrument. As shipped,
the value of R-18 is 20K, which provides an input sensitivity of -18 dB.
Changing the value of R-18 to 100K increases the sensitivity to -30 dB.
The output of the summing amplifier feeds a precision rectifier. The output
of the precision rectifier feeds a split to the PEAK and PERSISTENCE cir-
cuits.
Since the desired display is to be logarithmic, the signals are fed to corre-
sponding “linear/logarithmic” converters. The outputs of these converters
feed the display drivers. The driver for the PEAK display is configured as a
dot, while the driver for the PERSISTENCE display is configured as a
bargraph.
Each of the 40 LEDs derives an input from both of the drivers (only on all "A"
Type Monitors), with the exception of the red LEDs designated as -1, 0,+1.
These particular LEDs have no input from the dot driver, and therefore do
not display PEAK information. This provision was made to eliminate
possible confusion relative to PEAK and PERSISTENCE amplitudes at this
reference. With the exception of these LEDs, a steady state sine-wave will
illuminate a bargraph at a given amplitude, with the last displayed LED
brighter than the remainder. This gives indication that the amplitude of the
PERSISTENCE and the amplitude of the PEAK are equal, showing proper
alignment of the instrument.
CIRCUIT THEORY
DIFFERENTIAL
AMPLIFIER
DIFFERENTIAL
AMPLIFIER
REFERENCE
GENERATOR
PEAK
DETECTOR
AND HOLD
LIMITER
FILTER
LINEAR
LOGARITHMIC
CONVERTOR
LINEAR
LOGARITHMIC
CONVERTOR
DOT
LED
DRIVER
BAR
GRAPH
LED
DRIVER
LED
ARRAY
SUMMING
AMPLIFIER
PRECISION
RECTIFIER
POWER
SUPPLY
LEFT
RIGHT
+V LED
+V
-V
Fig. 14. Block Diagram of DORROUGH Loudness Monitor.
☛