solutions@shockwatch.com.au 1300 074 625 shockwatch.com.au May 2022
Remove the logger from the computer.
Start Recording
1. Press and hold the button for 5 secs to start the logger
until shows on the screen. The logger will start logging
once the Start Delay period set has elapsed.
2. Replace the cover and place it where it is required for
logging.
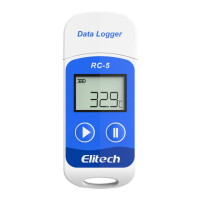
View logger information at any time
1. Press and release
to shift between display interfaces to
view information at any time.
2. Pressing the
button will scroll through to show:
• current temperature
• number of readings
• current time HH:MM
• date MM:DD
• maximum temperature recorded,
• minimum temperature recorded
• maximum temperature thresholds set.
• minimum temperature thresholds set.
Stop Recording
1. Press and hold for 5 secs to stop the logger until
shows in the logger screen. The logger has now stopped
logging.
Download Data
1. Remove the lid from the data logger and plug it into a
USB port on your PC.
2. Open the Elitech software and wait for the USB to be
recognised.
3. The software will open on the summary page and display
the device’s information. This page will show the statistical
information recorded on the logger.
This page provides:
• number of readings.
• the time of the rst and last readings.
• mean kinetic temperature.
• maximum temperature.
• minimum temperature.
• average temperature.
• time of the rst alarm (if any).
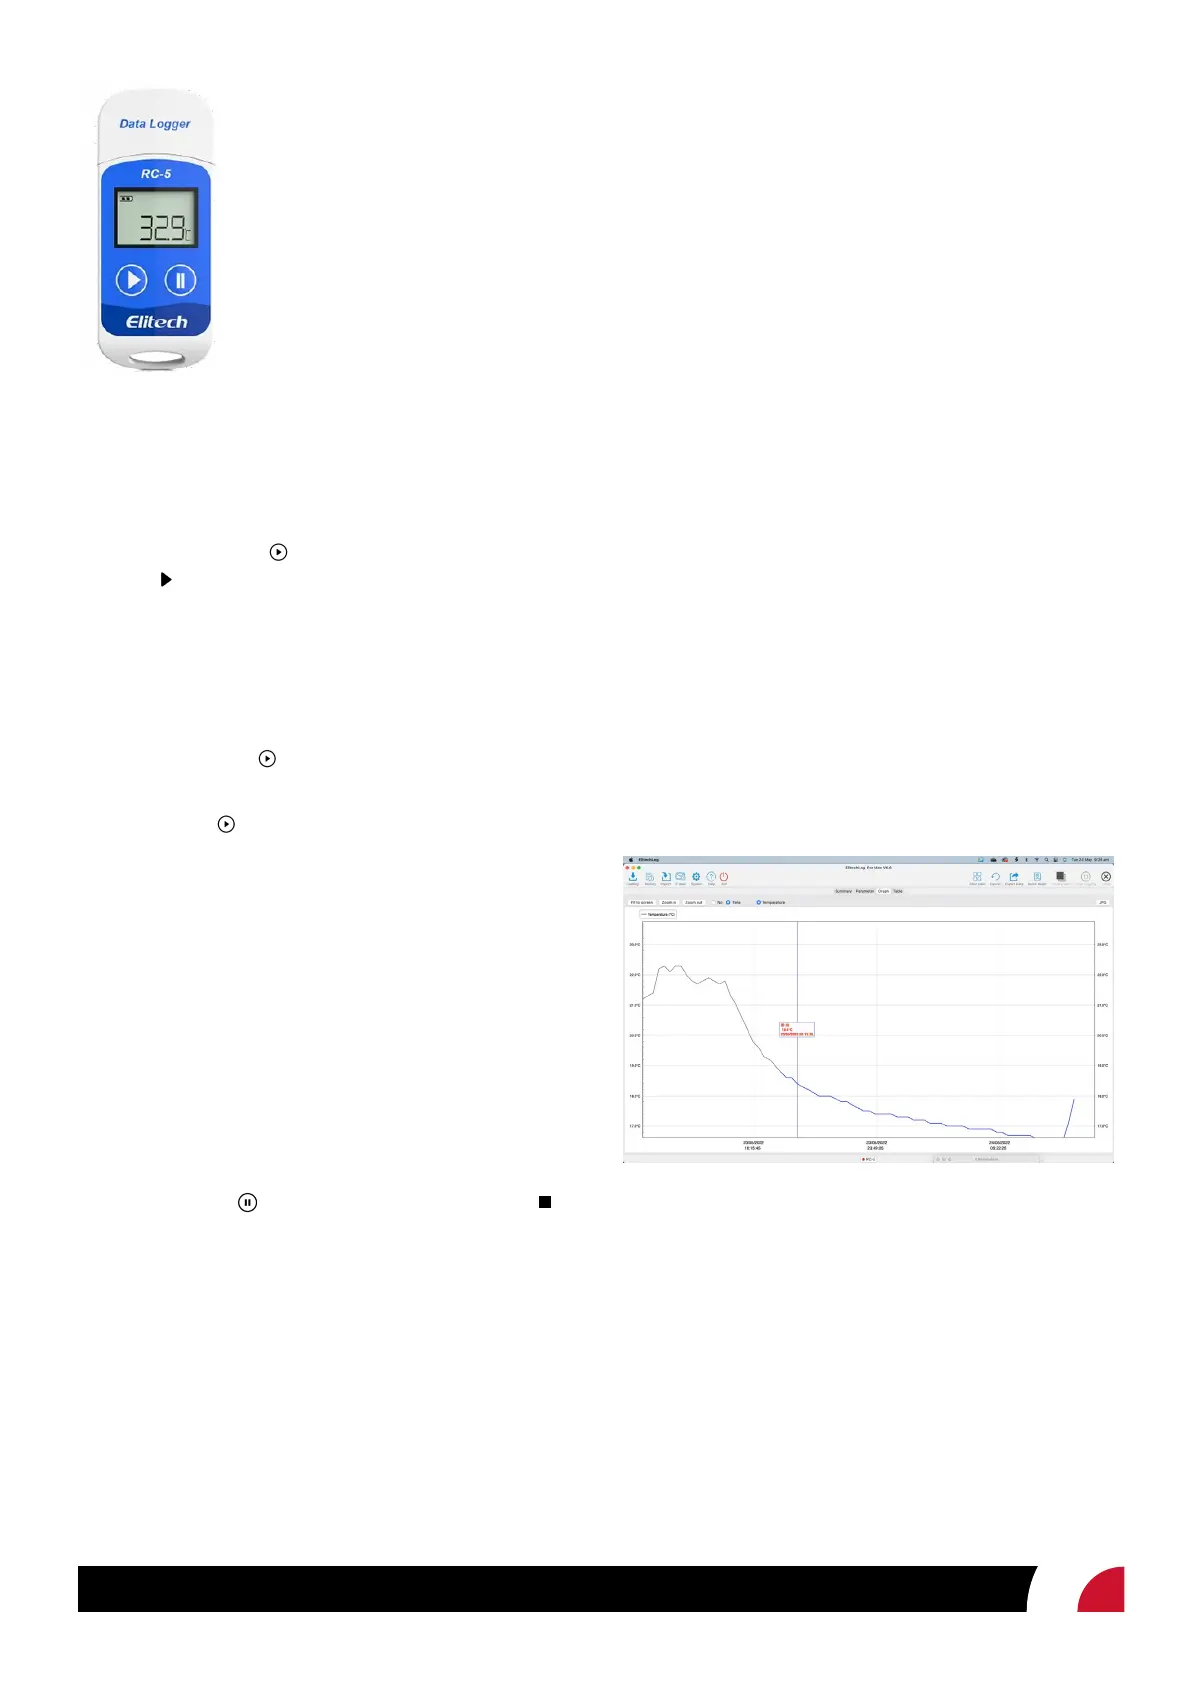
To view a complete breakdown of the data, select ‘Graph’
from the menu at the top of the screen. A graph will appear
displaying all the measured readings.
Clicking on the graph displays the log number, recorded
temperature and timestamp for each reading. Alternatively,
you can view the data as a complete list by selecting the
‘Table’ tab
To export and save your collected temperature data, click on
the ‘Export data’ icon at the top right of the page. You can
export data as a PDF, Excel or ELT, le.