6
Then hold the „SET/OK“ button for 3 seconds. Using the „HISTORY“ button, move between
values. „ENERGY/+“ and „COST/-“ increase/decrease the values. You can save the settings
by pressing „SET/OK“.
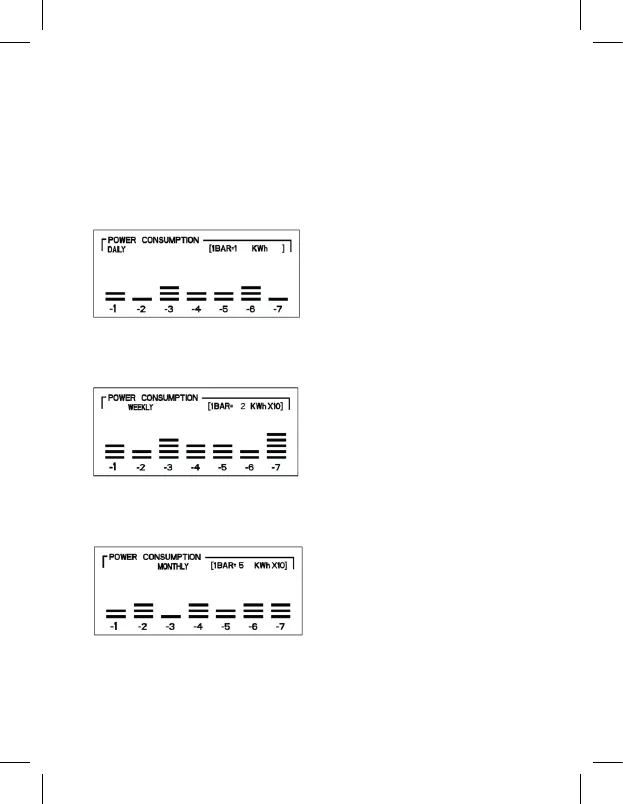
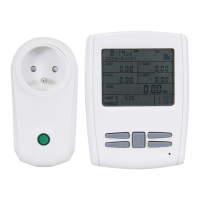
5. Consumption graph for the last 7 days/weeks/months
Using the „HISTORY“ button, you can change display settings to the last 7 days, 7 weeks
or7months.
7 days
the top right corner of the graph shows the conversion ratio, indicating the power con-
sumed. In this case, each bar corresponds to 1 kWh, i.e. yesterday, power consumption
was 2 kWh (1 kWh × 2 bars)
7 weeks
the top right corner of the graph shows the conversion ratio, indicating the power con-
sumed. In this case, each bar corresponds to 20 kWh (2 kWh × 10), i.e. last week, power
consumption was 60 kWh (20 kWh × 3 bars)
7 months
the top right corner of the graph shows the conversion ratio, indicating the power con-
sumed. In this case, each bar corresponds to 50 kWh (5 kWh × 10), i.e. last month, power
consumption was 100 kWh (50 kWh × 2 bars)
The individual power consumption values shown using bars are:
1BAR = 1 kWh
1BAR = 2 kWh
1BAR = 3 kWh
1BAR = 5 kWh
1BAR = 1 kWh × 10 (10 kWh)
1BAR = 15 kWh
1BAR = 2 kWh × 10 (20 kWh)
1BAR = 3 kWh × 10 (30 kWh)
1BAR = 5 kWh × 10 (50 kWh)