12 RH520A-en-GB_v4.8 6/19
MAX-MIN DISPLAYS
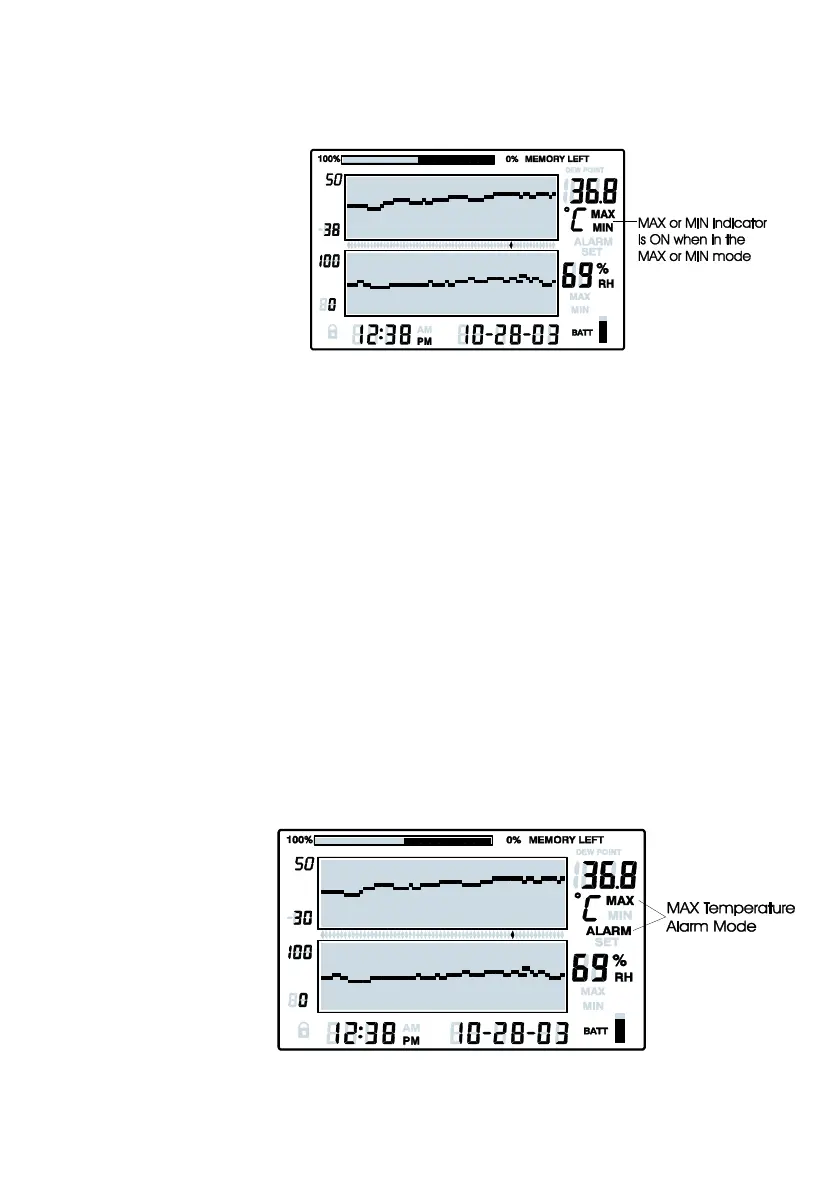
1. Press the VIEW button in the Standard View to display the highest (MAX) and lowest (MIN)
temperature and RH readings from all the stored measurement records.
2. When viewing the
highest readings, the
MAX indicator will switch
on. When viewing the
lowest readings, the MIN
icon will switch on.
3. The cursor will move to
the location of the MIN
or MAX reading within
the graph. If not within
the graph currently displayed, the cursor will move to the right-most position and the graph
will shift accordingly so that the relevant data point can be viewed.
4. Use the VIEW button to step through the highest and lowest temperature readings and then
the highest and lowest RH readings. When the MAX or MIN indicator is ON under the
temperature reading digits, the display is showing the MAX or MIN temperature. When the
MAX or MIN indicator is ON under the RH reading digits, the display is showing the MAX or
MIN relative humidity.
ALARM DISPLAYS
1. Press the ALARM button from the Standard View to analyze the most recent alarm activity
(temperature or humidity), if any. The ALARM display icon and the relevant upper
(temperature) or lower (RH) graph pixel will flash.
2. The cursor will move to the location within the graph. If not within the graph currently
displayed, the cursor will move to the right-most position and the graph will shift accordingly
so that the relevant data point can be viewed.
3. Press the ALARM button again to view the second most recent set of Alarms (if no alarms,
the Standard View will appear)
4. Press the ALARM button again to view the third most recent set of Alarms (if no alarms, the
Standard View will appear)
5. This procedure can
continue until no
further alarms exist
and pressing the
ALARM button will
only bring up the
Standard View
6. In the example
diagram, the RH520A
is showing a high
temperature alarm (MAX and ALARM indicators on).