15
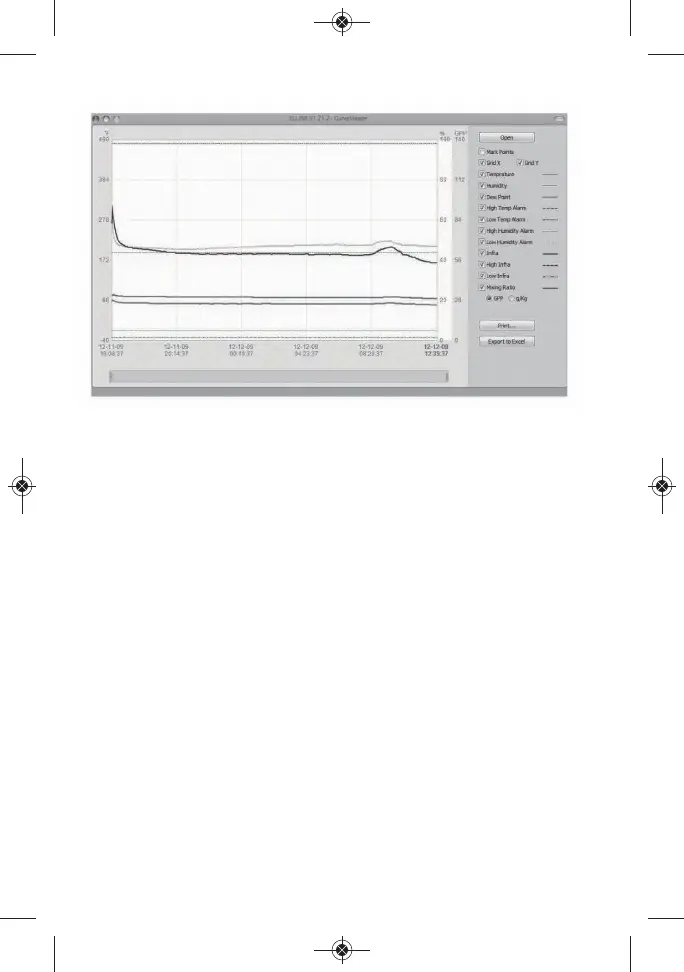
Fig. 4. A typical initial plot of an imported data log
There are several features shown in Fig. 4 worth noting:
• To mark the position of every recorded data point on the
curve, check the “Mark Points” box at the top of the sidebar
at right.
• To get a higher-resolution view of the data recorded during
a specific period of time, scale up and down the curves by
dragging the slider at the bottom of the w
indow to the left
and right.
• Hovering the cursor over a particular point of the curve
displays all data related to this point—including the
maximum, minimum and average values of the entire
curve—in a shaded box at upper left.
• The dates and times shown on the x-axis scale and in the
upper left corner are in sync with your computer’s clock.
• To print the .txt file of any data log, click the Print virtual
button.