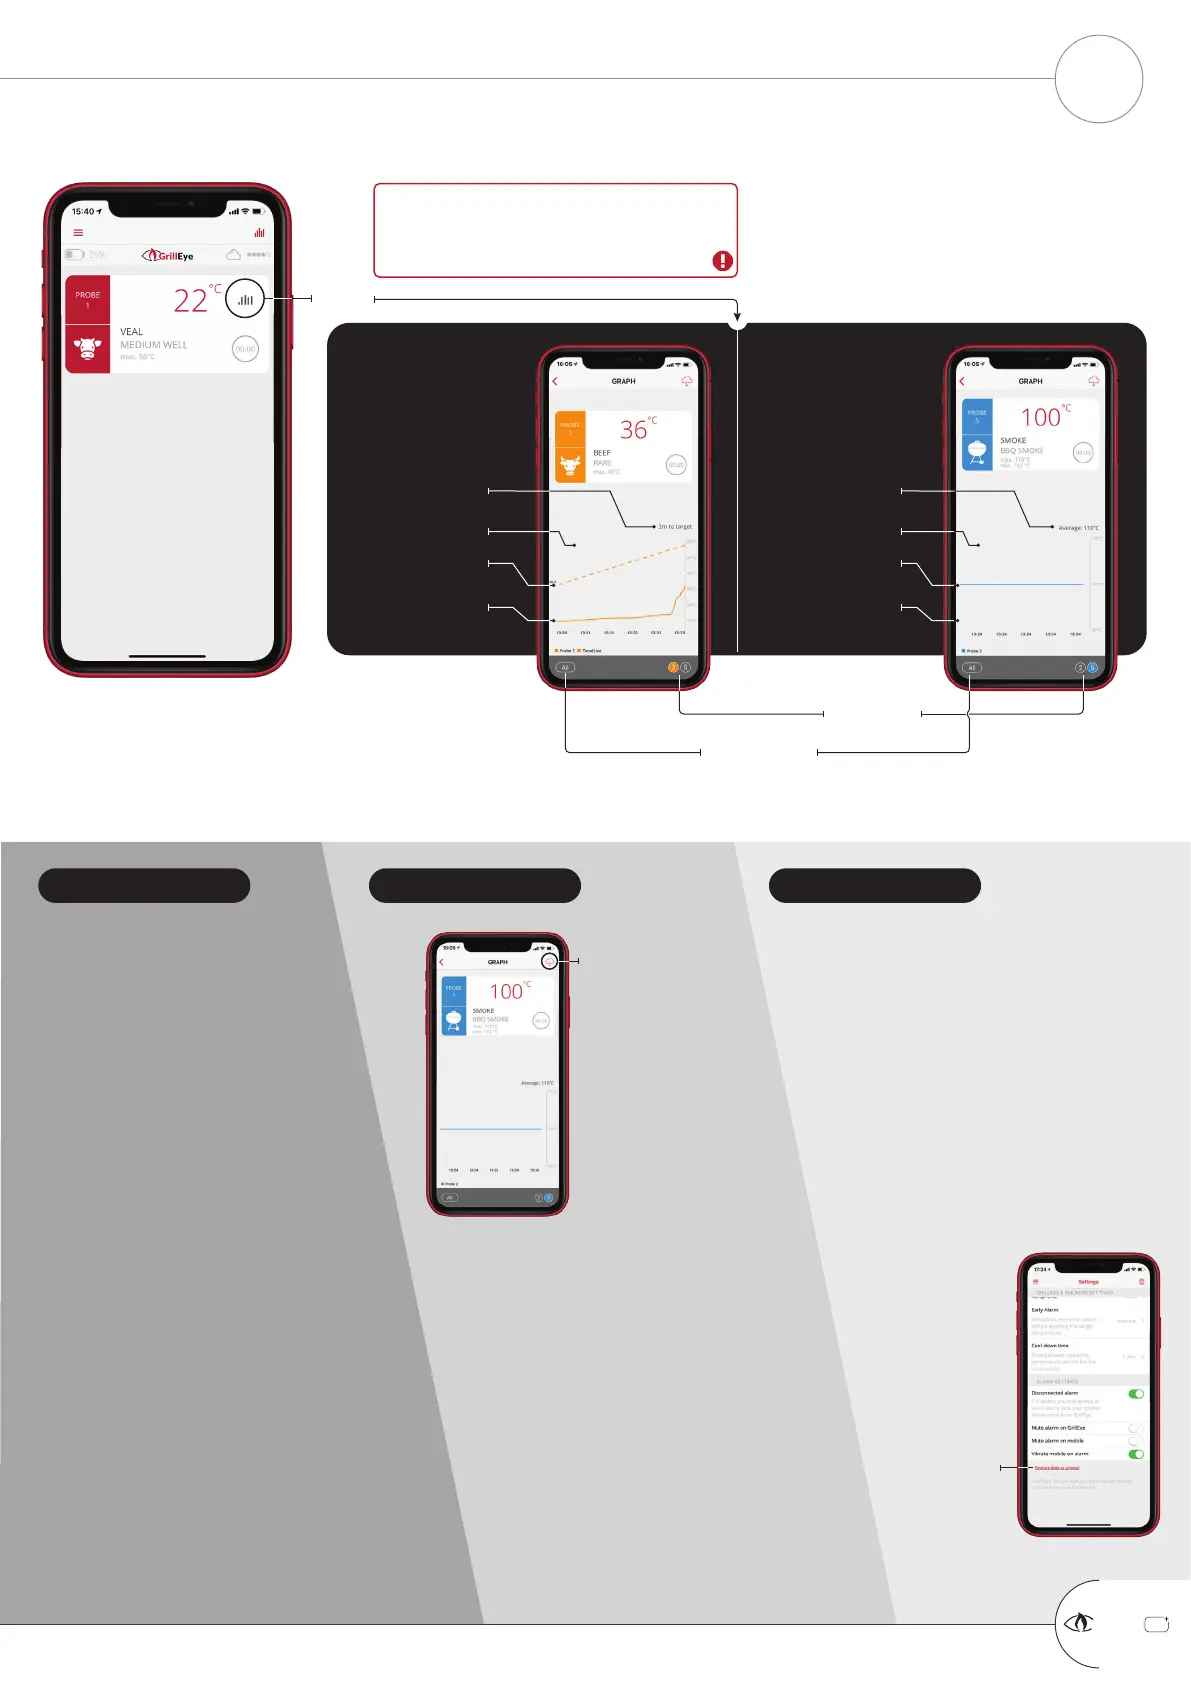
Press
PEAK PRESETS
Actual temperature
RANGE PRESETS
Adjusted course to
target
Select probe
to view
Estimated time to
target
Target temperature
Lower temp. limit
Actual temperature
Average temperature
Upper temp. limit
TEMPRATURE GRAPHS ONLY ON CLOUD
When in Bluetooth
®
mode, graphs are
disabled since the device is designed to store
data to the Cloud.
View all probes
in one graph
When viewing all probes in one
graph, preset limits (upper and lower
or peak in case of range and peak
presets respectively), will not appear.
In multi-view you are able to view all of
your probe temperatures in real time.
This feature is especially useful when
viewing a probe used for ambient
temperature readings along with probes
used for actual grilling or cooking.
The graph export
generates a .csv
file.
In order to view the
exported data in a
meaningful manner,
follow the steps below:
1) mark the start time of
your session (e.g. 14.30)
2) open the .csv file and
select the option to
convert data from text to
columns using comma “,” delimiter
3) add a line to represent the time above the
line where the temperature data are written, and
on the column above the first temperature
reading insert the start time of your session
4) add a second on every following column (on
the line of time). This will generate entries like
14.30.01, 14.30.02, 14.30.03 etc. until reaching
the final temperature reading
5) now that you have your time-temperature
pair you can replicate the graph in your
spreadsheet and analyze in any way you wish.
+
GrillEye Pro
®
TEMPERATURE GRAPHS
START GRILLING & COOKING
11
MULTI-VIEW EXPORT GRAPH RESET GRAPH
Press to export
Press to view
available
options
GrillEye is designed to memorize your sessions
and keep them for you to revisit them.
When the displayed data accumulate more than
you wish, you can reset them from the settings
menu of the app, by following the steps below:
1) navigate to menu/settings
2) scroll to the bottom of the settings page
(illustrated)
3) press the “Restore data to original” option
4) select the “Reset graph” option and you
are ready!
 Loading...