Performance and curves diagrams
Domestic air conditioner
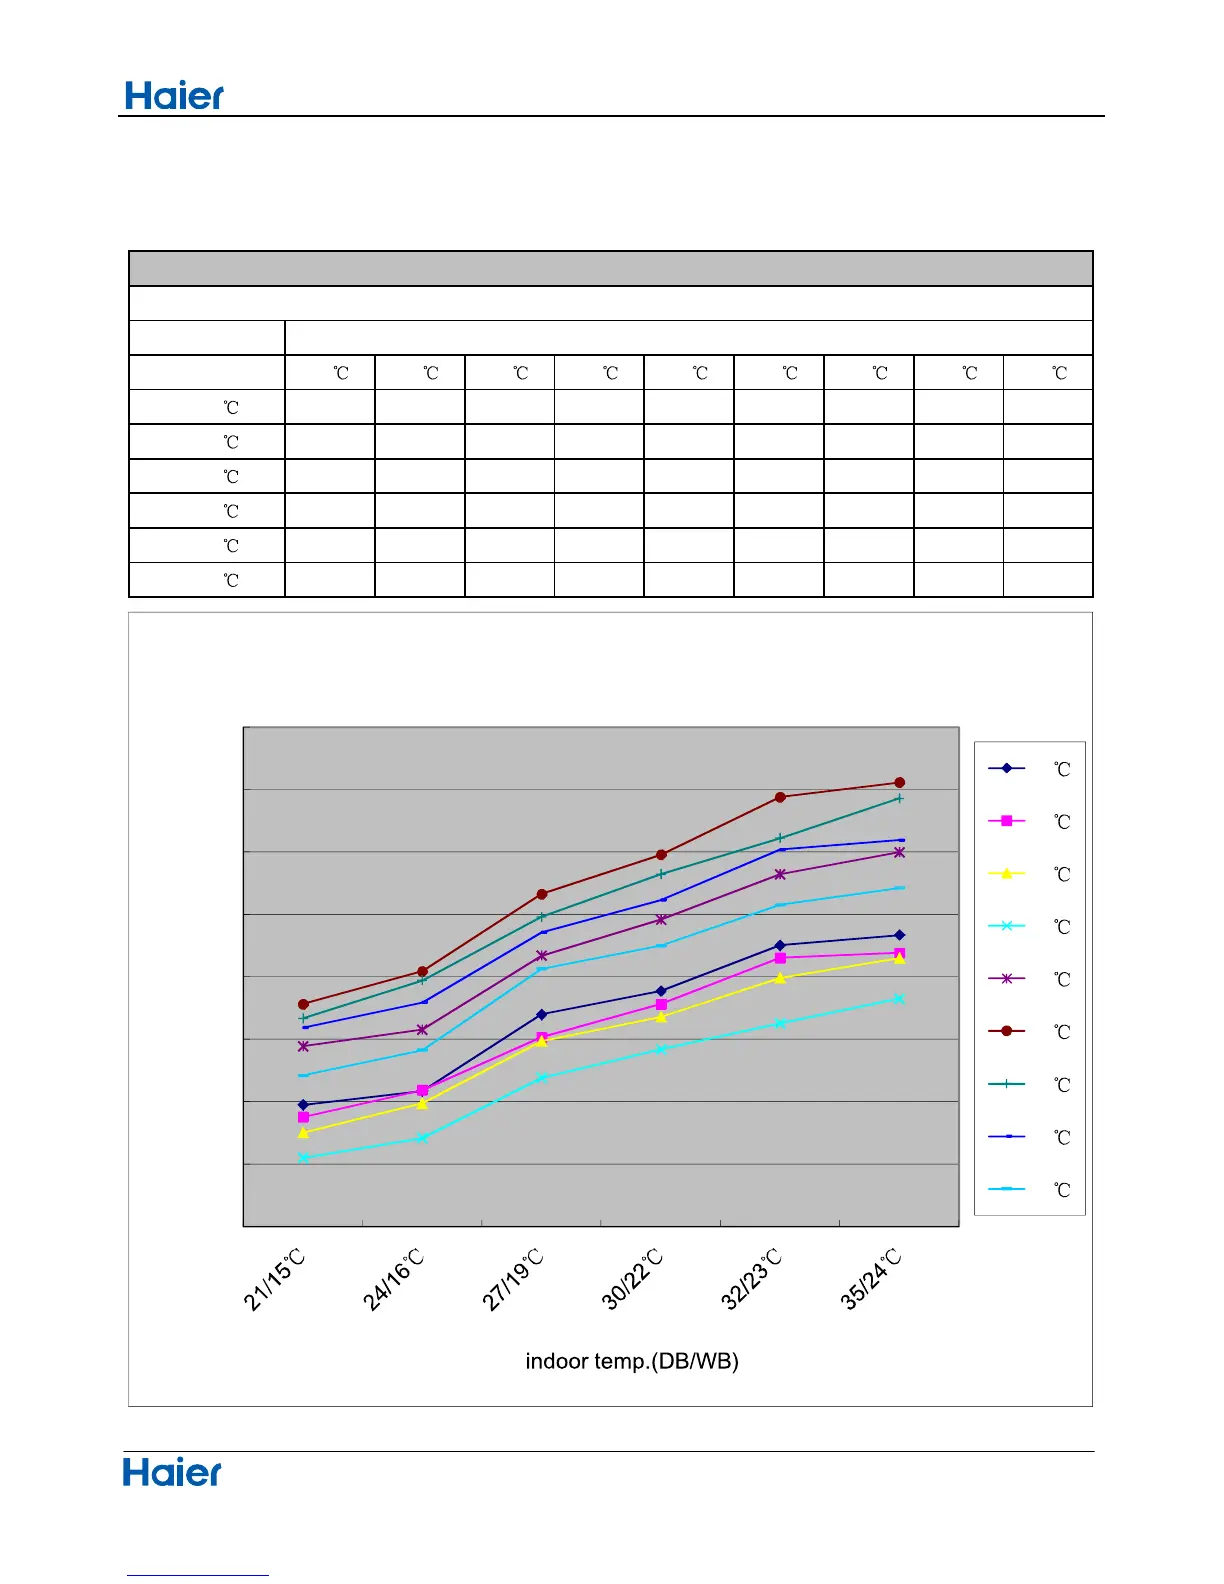
11.Performence and curves diagrams
11.1 Cooling capacity-temperature curves
48
indoor temp.
DB/WB
10
15 20 25 30 35 38 40 43
21/15
3975 3879 3752 3552 4445 4783 4668 4595 4212
24/16
4086 4095 3987 3709 4578 5045 4973 4795 4415
27/19
4701 4517 4487 4191 5170 5665 5481 5358 5066
30/22
4888 4784 4680 4420 5460 5980 5824 5616 5252
32/23
5254 5154 4994 4628 5823 6442 6112 6021 5578
35/24
5336 5193 5152 4827 6000 6559 6432 6097 5713
cooling value-temerature table
performance curves
outdoor temp.
3000
3500
4000
4500
5000
5500
6000
6500
7000
cooling capacity (W)
cooling capacity and indoor/outdoor temp.curves
10
15
20
25
30
35
38
40
43