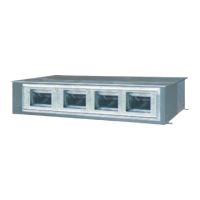
Commercial Air Conditioner Model: AU96NATAEA
AD96NAHAEA, AP96NACAEA
82
Temp. – COP performance curves
1
2
3
4
5
-7 -5 0 6 10 15
outdoor DB (℃)
COP
16
18
20
22
24
26
28
c. Air flow and static pressure curves
1.The digits in the circle stand for the air step of the fan speed control board.
2.The red real line shows the air flow and static pressure changing state at different air step in
high speed; the blue dashed line shows the air flow and static pressure changing state at
different air step in low speed.
air flow(m/min)
70
100
0
55
50
60
65
150
200
4
3
High
Low
3
75 80
5
6
8586
8
7
8
6
7
5
4
3
high
limit
low
limit

 Loading...