Performance and curves diagrams
Domestic air conditioner
11.Performence and curves diagrams
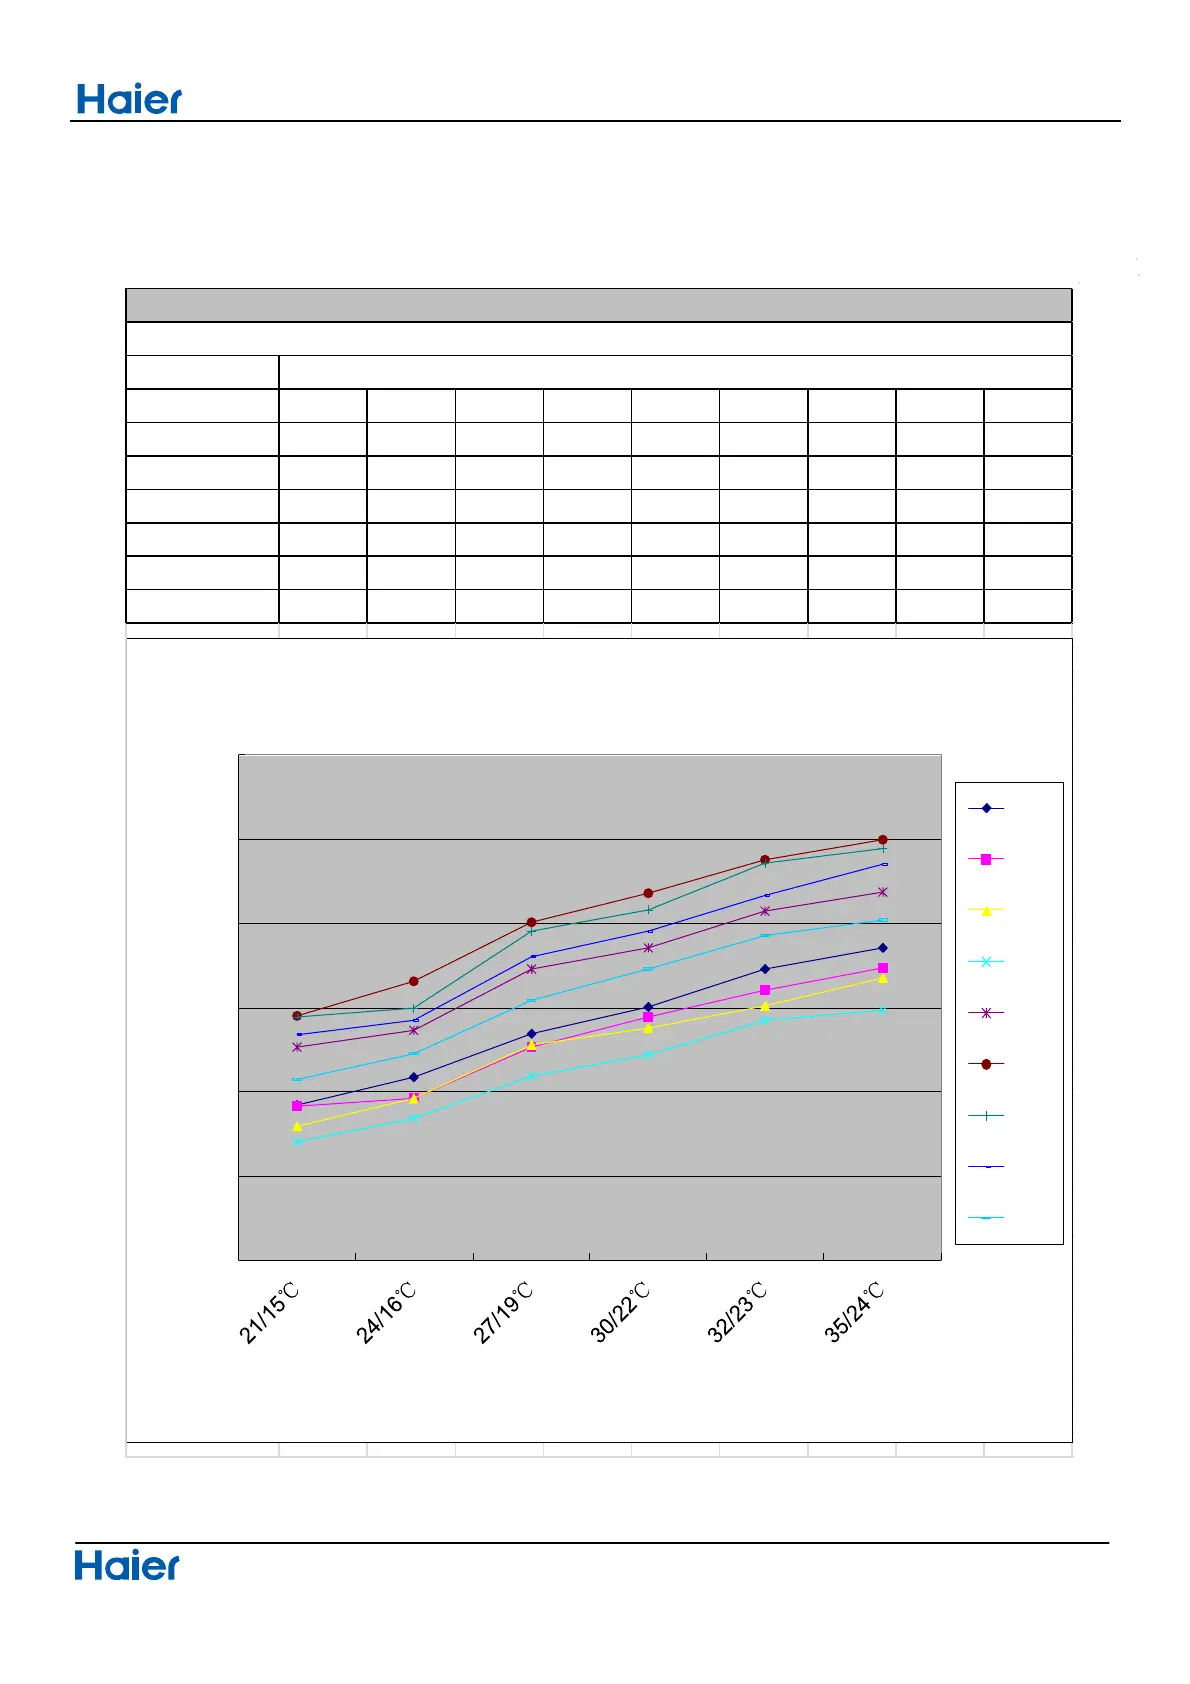
11.1 Cooling capacity-temperature curves
48
indoor temp.
DB/WB 10℃ 15℃ 20℃ 25℃ 30℃ 35℃ 38℃ 40℃ 43℃
21/15℃ 2421 2418 2296 2207 2764 2953 2944 2843 2578
24/16℃ 2589 2466 2461 2343 2865 3156 3000 2927 2726
27/19℃ 2848 2767 2778 2597 3234 3512 3455 3302 3044
30/22℃ 3008 2944 2880 2720 3360 3680 3584 3456 3232
32/23℃ 3232 3105 3011 2925 3577 3879 3858 3667 3432
35/24℃ 3354 3239 3180 2983 3687 3998 3945 3854 3521
cooling value-temerature table
outdoor temp.
1500
2000
2500
3000
3500
4000
4500
cooling capacity and indoor/outdoor temp.curves
10℃
15℃
20℃
25℃
30℃
35℃
38℃
40℃
43℃
indoor temp.(DB/WB)
 Loading...