22 HP App Summaries
HP App Summaries22
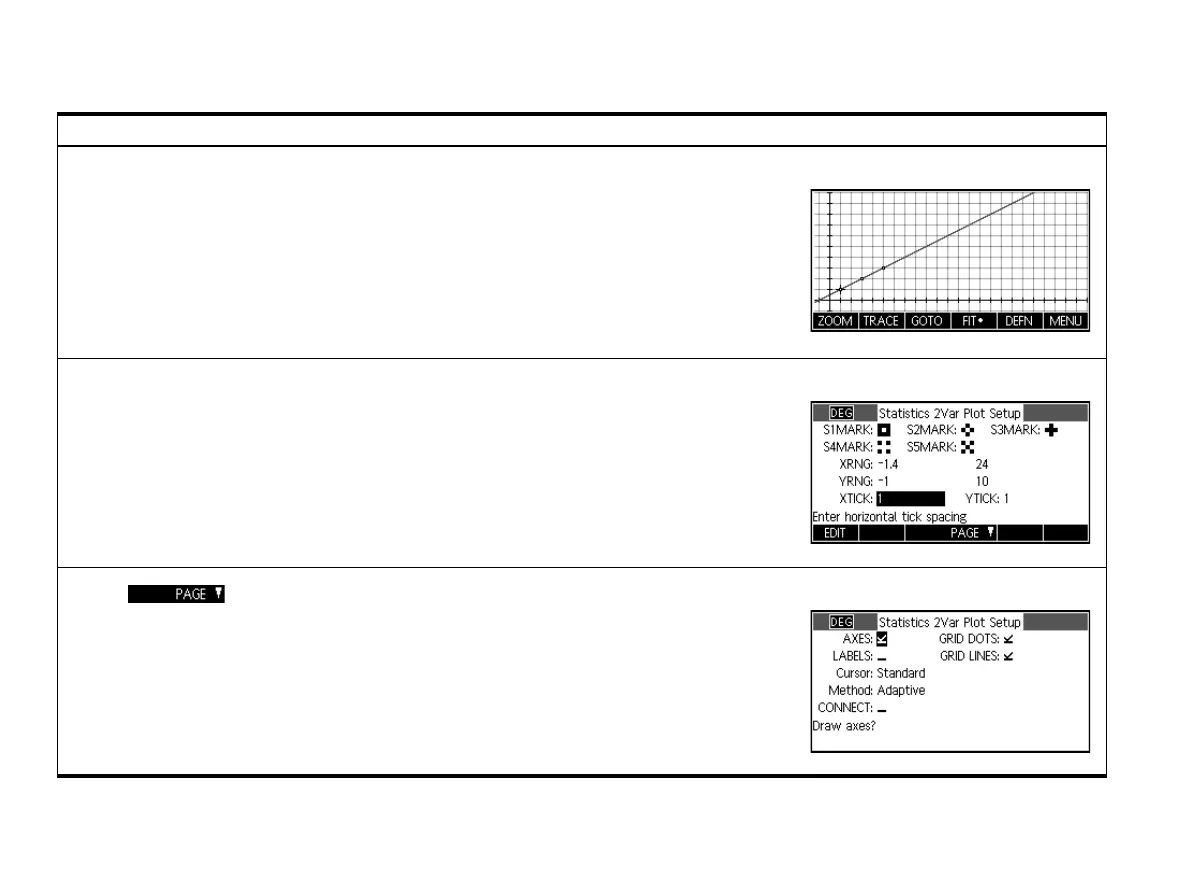
Press Plot to enter the Stats 2-Var Plot view. This view displays the selected 2-variable
statistical plots for the active analyses. The menu items are:
• ZOOM: zooms in or out on the graph(s)
• TRACE: toggles tracing on and off
• GOTO: jumps to a desired data point
• FIT: toggles displaying a fit for each scatter plot
• DEFN: shows the definition of the current graph being traced
• MENU: reveals and hides the menu
Statistics 2-Var Plot View
Press SHIFT followed by Plot to enter page 1 of the Stats 2-Var Plot Setup. This view is similar
to page 1 of the Stats 1-Var Plot Setup, except that you can choose different marks for each
scatter plot.
Statistics 2-Var Plot Setup Page 1
Press to enter page 2 of the Statistics 2-Var Plot Setup. This view is the same as
Page 2 of the Function Plot setup.
Statistics 2-Var Plot Setup Page 2
Table 7 Statistics 2-Var App Summary
Summary of Functionality View Name and Display

 Loading...


