SECTION I
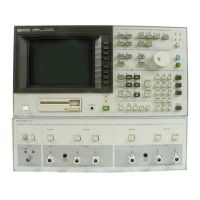
Model 4145A
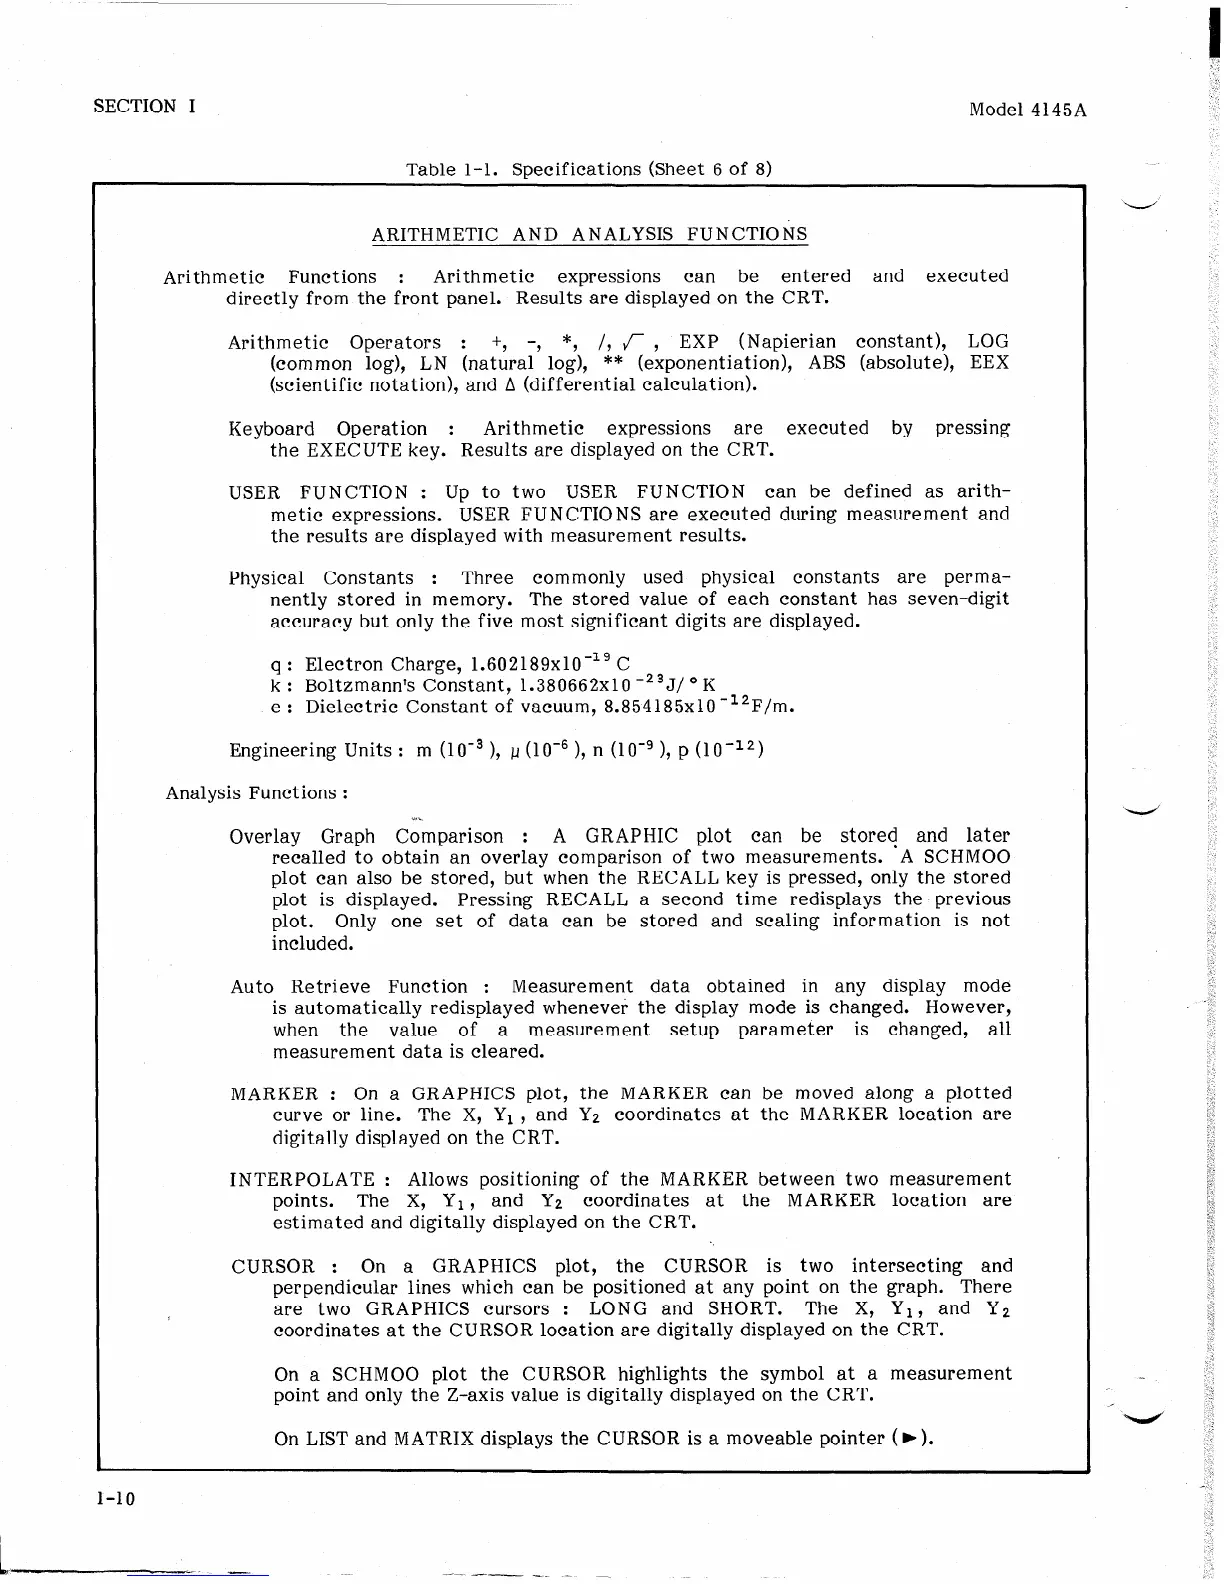
TRhle l-l. Srwcifimtions (Sheet G of 8)
ARITHMETIC AND ANALYSIS FUNCTIONS
Arithmetic Functions : Arithmetic
expressions can be entered and executed
directly from the front panel. Results are displayed on the CRT.
Arithmetic Operators : +, -, *, /, /- , EXP (Napierian constant), LOG
(common log), LN (natural log), ** (exponentiation), ABS (absolute), EEX
(scientific notation), and A (differential calculation).
Keyboard Operation : Arithmetic expressions are executed by pressing
the EXECUTE key. Results are displayed on the CRT.
USER FUNCTION : Up to two USER FUNCTION can be defined as arith-
metic expressions. USER FUNCTIONS are executed during measurement and
the results are displayed with measurement results.
Physical Constants : Three commonly used physical constants are perma-
nently stored in memory. The stored value of each constant has seven-digit
accuracy but only the five most significant digits are displayed.
q : Electron Charge, 1.6O2189x1O-1g C
k : Boltzmann’s Constant, 1.380662~10 -2 3 J/ O K
e : Dielectric Constant of vacuum, 8.854185~10 -12F/m.
Engineering Units : m (10V3 ), p (lo+ ), n (lo-’ ), p (10-12)
Analysis Functions :
Overlay Graph Comparison :
A GRAPHIC plot can be stored and later
recalled to obtain an overlay comparison of two measurements. -A SCHMOO
plot can also be stored, but when the RECALL key is pressed, only the stored
plot is displayed. Pressing RECALL a second time redisplays the previous
plot. Only one set of data can be stored and scaling information is not
included.
Auto Retrieve Function : Measurement data obtained in any display mode
is automatically redisplayed whenever the display mode is changed. However,
when the value of a measurement setup parameter is changed, all
measurement data is cleared.
MARKER :
On a GRAPHICS plot, the MARKER can be moved along a plotted
curve or line. The X, Y1 , and Y2 coordinates at the MARKER location are
digitally displayed on the CRT.
INTERPOLATE : Allows positioning of the MARKER between two measurement
points. The X, Y1, and Ye coordinates at the MARKER location are
estimated and digitally displayed on the CRT.
CURSOR : On a GRAPHICS plot, the CURSOR is two intersecting and
perpendicular lines which can be positioned at any point on the graph. There
are two GRAPHICS cursors : LONG and SHORT. The X, Y 1, and Y2
coordinates at the CURSOR location are digitally displayed on the CRT.
On a SCHMOO plot the CURSOR highlights the symbol at a measurement
point and only the Z-axis value is digitally displayed on the CRT.
On LIST and MATRIX displays the CURSOR is a moveable pointer ( b ).
l-10

 Loading...