Operation
Measurement
Triggering
Free Run at maxi-
mum rate,
Trigger immediately
Free Run with set-
tling time
or
Trigger
with settling time.
3-20
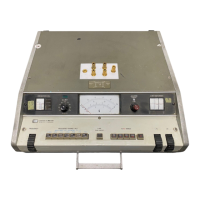
Model
436A
Table
3-5.
Power
Meter
Remote
Access
Time
to
First
Output
Data
Character
Mode
Worst
Case
Access
Time
to
First
Output
Character
Range
1
or
2
Range
3,4
or
5
WATT
70 ms 70 ms
dBm
90ms
90 ms
dB
(REL)
160ms
160
ms-
db
[REF]
160
ms 160 ms
WATT
1130 ms
190ms
dBm
1130 ms
190ms
dB
(REL) 1200 ms
260ms
db
[REF]
160
ms
160 ms
MAX
THRESHOLD---.....
OF
RANGE
,..__,,,_
________
_
INPU-Tr,_....,,........,---,.--,.--,---r-,--.....,...--,--,..-;
M
IN
TH R
ESHO
LO
llXI
l--!---!---!---!--!--1---1--1--'----='--
0
F RANGE
~
_H+.-
I-
z
w
u
a:
w
...
W
l--1---1---1---~I
_1._~',......-:-11--+--+__,_-
8S
1--+-+-+-+-.rll
/_-+-I
--+---+--+--+--
~
1--4--4--4--~
.,~+-'
--:--1--I
-!----1--1-
11
7S
'
I I
70
6S
60
S5
I
so
l
45
t---
1--
I I I
/I
I
I I
I I I
40
t---
1--
35
t---
~
30
t---
r-1
1S
t---
/
20
ll
I I
I _ _
__
,
10
._,
5
,
I
___}
+~
__l___i\
#
.
I
Auto
Range
Compute measurement times from Figure
3-5
and
add measurement time of each range
that
Power
Meter steps through
to
delay time listed below.
From
To
Delay
From
To
Delay
1
2
1070
ms
3 2
1070 ms
2
1
1070 ms
4 3,5
133
ms
2
3
133
ms
5
4 133 ms
Examples: Starting
at
block labeled
"HOLD"
in
Figure 3-5, worst case access time for range
1-3,
and range
3-1
changes with WATT
MODE
se-
lected are:
Range 1
70 ms
Range 3
50ms(33+17)
1-2
Delay 1070 ms
3-2
Delay 1070
ms
Range 2 53 ms
Range 2
33 ms
2-3
Delay
133
ms
2-1Delay1070
ms
Range 3
53ms
Range 1
33
ms
1379 ms
2256 ms
Compute worst case
Auto
Range access times
from Figure 3-5.
Examples: Starting
at
block labeled "HOLD" in
Figure 3-5; worst case access times for range 1-3
and range 3-1 with
WATT
MODE
selected are:
1
-3 (1070 + 53, +1070 + 53 +
133
+ 53) =2432
ms
3-1(133+33+
1070+33+1070
+ 33)
=
2372 ms.
I
I
I\
\
\
I\
\
1\
\
i\.
......
I
~
RANGE
I
D
I
2
3 4
S
6 7 8 9
10
0
l 2 l 4
S
6 7 8 9
10
2 0
.1 .2
.3
.4
.s
.6 .7 .8 .9 l
0
.l
.2
.l
,4
.s
,6 .7
.8
.9 1
3?
0 .01 .02 .03 .04
.OS
.06
.07
.08 .09
.l
0
.DI
.02
.OJ
.04
.OS
.06
.07
.08 .09
.l
TIME IN SECONDS
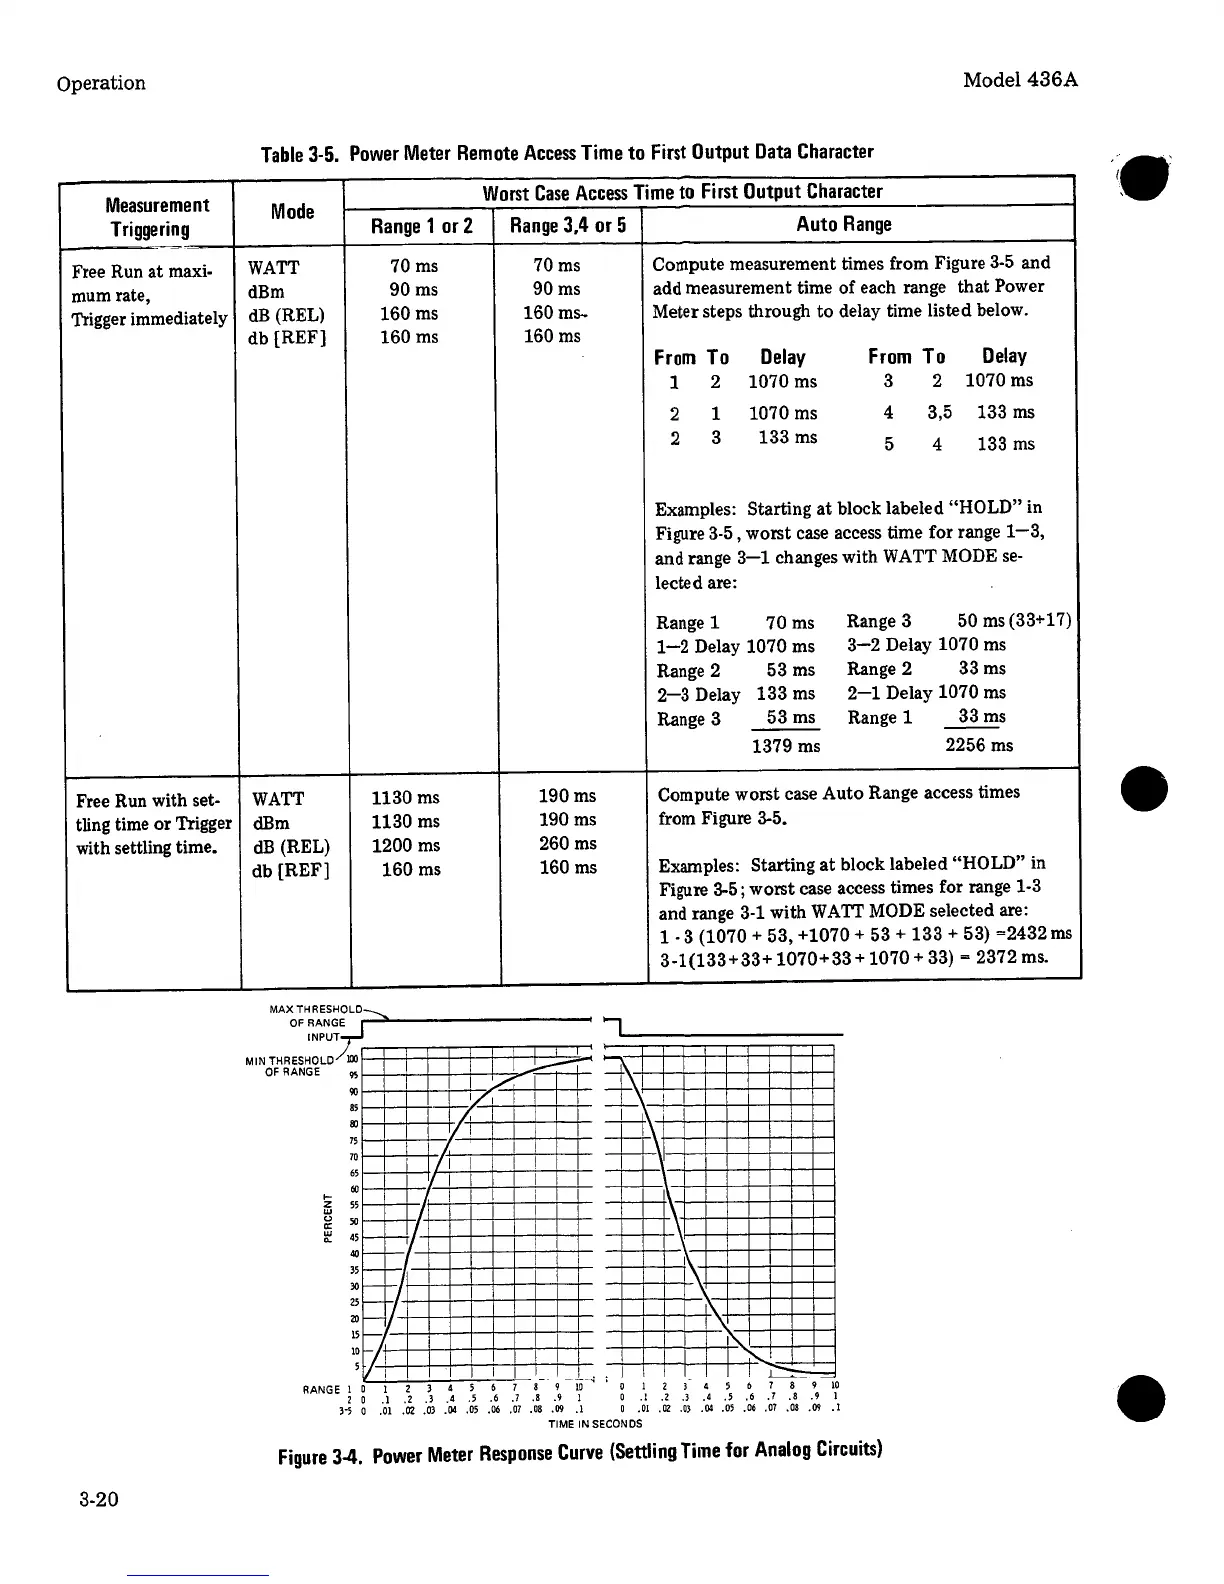
Figure
3-4.
Power
Meter
Response
Curve
(Settling
Time
for
Analog
Circuits)
•
•
 Loading...