The
analyzer has
one time-to-frequency
transform mode:
F
orward transform
mode
transforms
CW
signals
measured
over
time
into
the
frequency
domain,
to measure
the
spectral
content
of
a
signal.
This
mode
is
known
as
the CW
time
mode
.
In
addition to
these
transform
modes
,
this
section
discusses
special
transform
concepts
such
as
masking,
windowing,
and
gating.
General
Theory
The
relationship
between
the
frequency
domain
response
and the
time domain
response of
the
analyzer
is
dened
by
the
F
ourier transform.
Because of
this transform,
it is
possible
to
measure
,
in
the
frequency
domain,
the
response of
a linear
test device
and mathematically
calculate
the
inverse
F
ourier
transform
of
the data
to nd
the time
domain response
.
The
analyzer's
internal
computer
makes this
calculation using
the chirp-Z
Fourier
transform
technique
.
The
resulting measurement
is the
fully error-corrected
time domain
reection
or
transmission
response
of
the test
device,
displayed in
near real-time
.
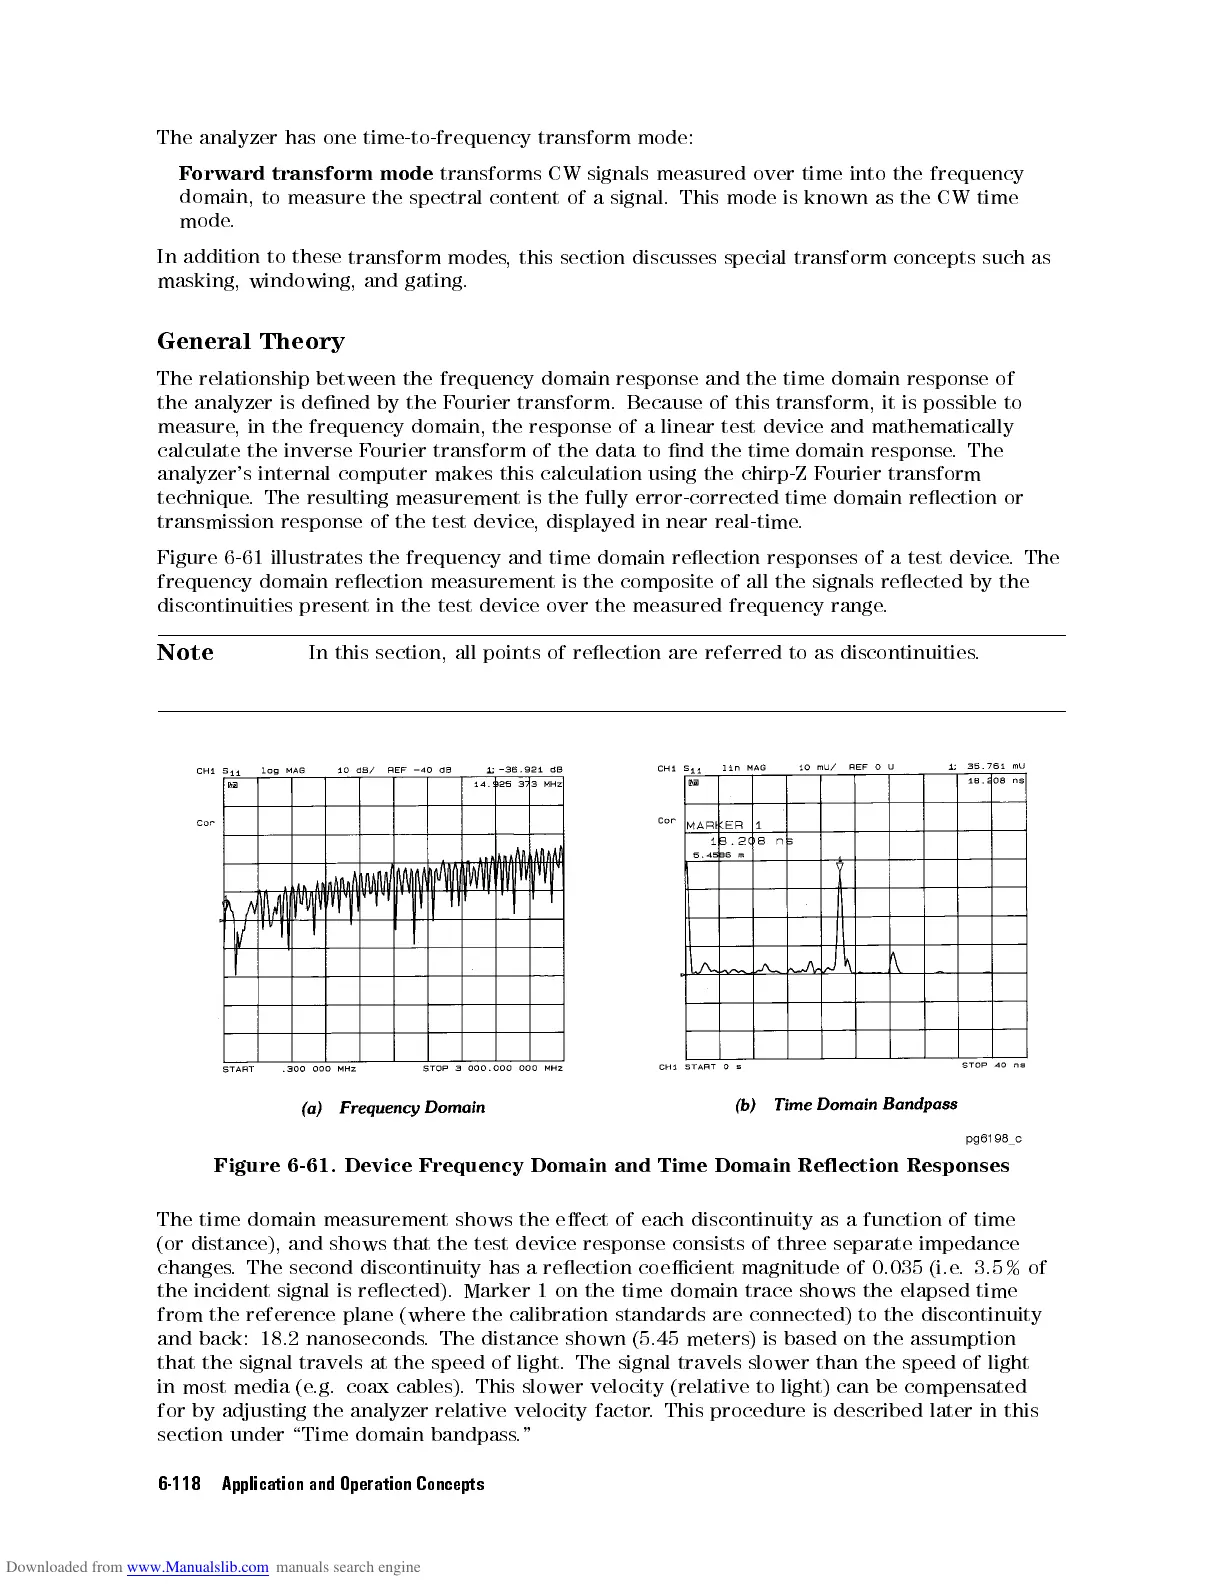
Figure
6-61
illustrates
the
frequency
and
time
domain
reection
responses
of
a test
device
.
The
frequency
domain
reection
measurement
is
the
composite
of
all
the
signals
reected
by
the
discontinuities
present
in
the
test
device
over
the
measured
frequency
range
.
Note
In this
section,
all
points
of
reection
are
referred
to
as
discontinuities
.
Figure 6-61. Device Frequency Domain and Time Domain Reection Responses
The time domain measurement shows the
eect of each discontinuity as a function of time
(or distance), and shows that the test
device response consists of three separate impedance
changes. The second discontinuity has a reection
coecient magnitude of 0.035 (i.e
. 3.5% of
the incident signal is reected). Marker 1 on the time domain trace shows the elapsed time
from the reference plane (where the calibration standards are connected) to the discontinuity
and back: 18.2 nanoseconds. The distance shown (5.45 meters) is based on the assumption
that the signal travels at the speed of light. The signal travels slower than the speed of light
in most media (e.g. coax cables). This slower velocity (relative to light) can be compensated
for by adjusting the analyzer relative velocity factor. This procedure is described later in this
section under \Time domain bandpass."
6-118 Application and Operation Concepts
 Loading...


