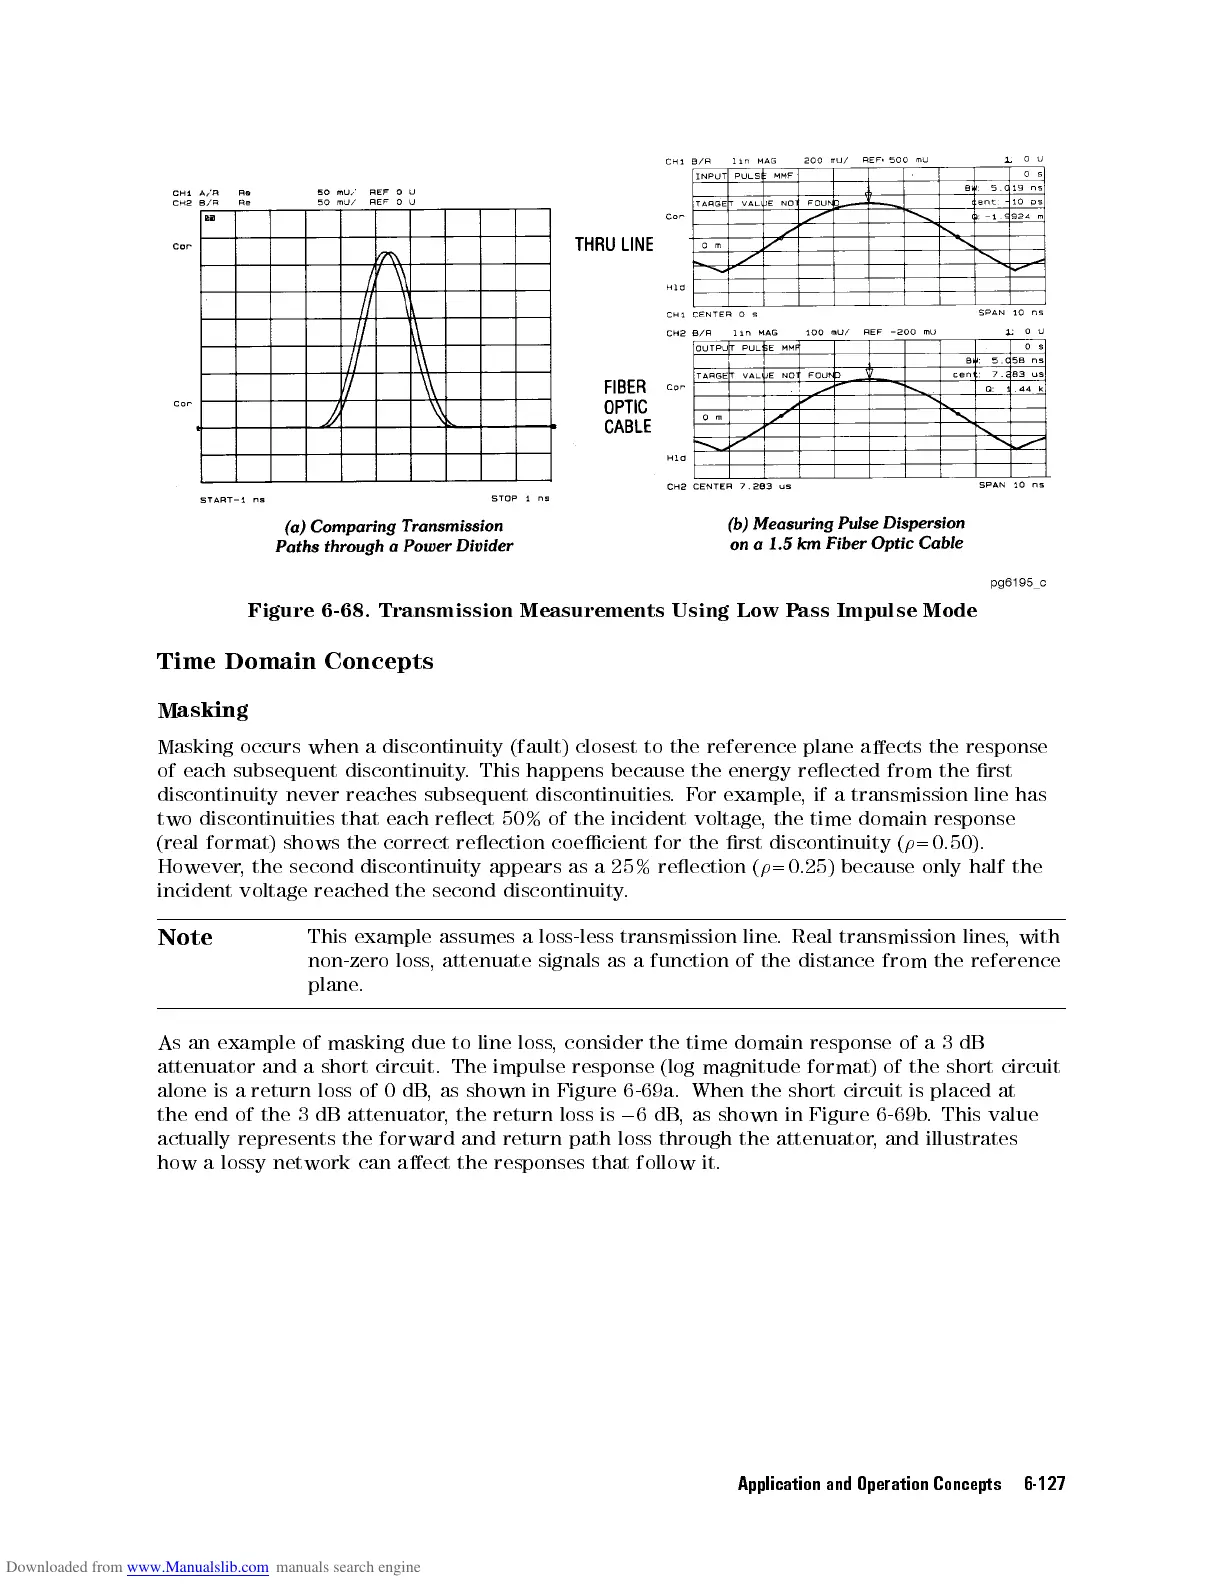
Figure 6-68.
Transmission Measurements
Using
Low
P
ass
Impulse
Mode
Time
Domain
Concepts
Masking
Masking
occurs
when
a
discontinuity
(fault)
closest
to
the
reference
plane
aects
the
response
of each
subsequent
discontinuity
.
This
happens
because
the
energy
reected
from
the
rst
discontinuity never
reaches
subsequent
discontinuities
.
F
or
example
,
if
a
transmission
line
has
two
discontinuities that
each
reect
50%
of
the
incident
voltage
,
the
time
domain
response
(real
format)
shows
the
correct
reection
coecient
for
the
rst
discontinuity
(
=0.50).
However
,
the
second
discontinuity
appears
as
a
25%
reection
(
=0.25)
because
only
half
the
incident
voltage
reached
the
second
discontinuity
.
Note
This
example
assumes
a
loss-less
transmission
line
.
Real
transmission
lines
,
with
non-zero
loss
,
attenuate
signals
as
a
function
of
the
distance
from
the
reference
plane
.
As
an
example
of
masking
due
to
line
loss
,
consider the
time domain
response of
a3
dB
attenuator
and
a
short
circuit.
The
impulse
response
(log
magnitude format)
of
the
short
circuit
alone is a return loss of 0 dB
, as shown in Figure 6-69a. When the short circuit is placed at
the end of the 3 dB attenuator
, the return loss is
0
6dB
, as shown in Figure 6-69b
. This
value
actually represents the forward and return path loss through the attenuator
, and illustrates
how
a lossy network can aect the responses that follow it.
Application and Operation Concepts 6-127