EasyManuals Logo

HP HP-11C User Manual

HP HP-11C
264 pages
To Next Page IconTo Next Page
To Previous Page IconTo Previous Page
Page #67 background imageLoading...
Page #67 background image
Section
3:
Numeric
Functions
65
y
5
|
(6.8,
)
4
4
3T
(4.5.3.0)
(4.0,
y)
2
1
(3.0,
2.0)
14+
(1.5,
1.0)
}
i
}
%
5
}
}
X
1
2 3
4
5
6 7
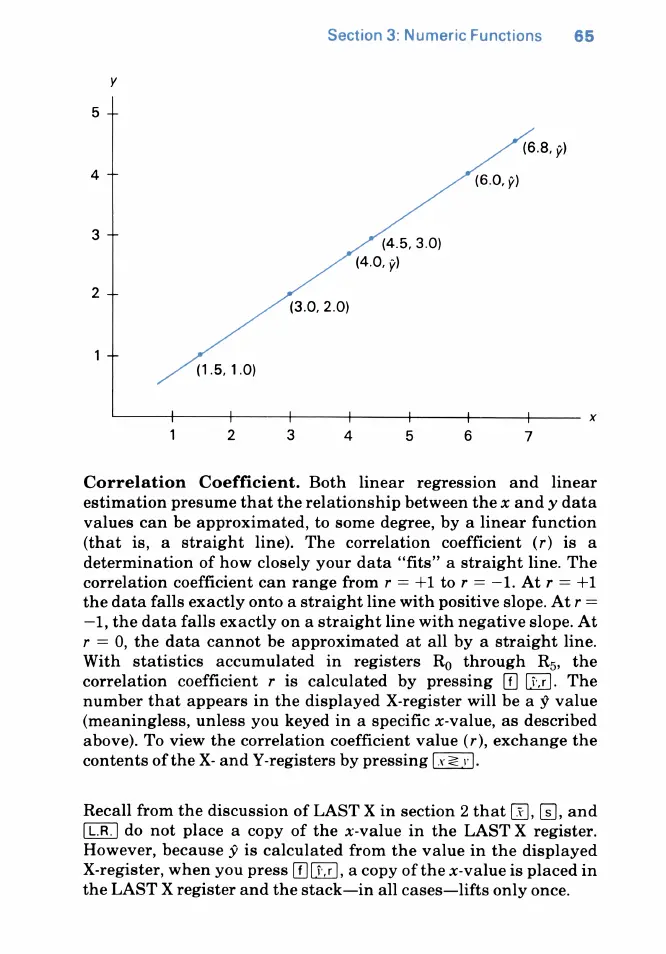
Correlation
Coefficient.
Both
linear
regression
and
linear
estimation
presume
that
the
relationship
between
the
x
and
y
data
values
can
be
approximated,
to
some
degree,
by
a
linear
function
(that
is,
a
straight
line).
The
correlation
coefficient
(r)
is
a
determination
of
how
closely
your
data
‘“fits”
a
straight
line.
The
correlation
coefficient
can
range
fromr
=
+1tor
=—-1.
Atr
=
+1
the
data
falls
exactly
onto a
straight
line
with
positive
slope.
At
r
=
—1,
the
data
falls
exactly
on
a
straight
line
with
negative
slope.
At
r
=
0,
the
data
cannot
be
approximated
at
all
by
a
straight
line.
With
statistics
accumulated
in
registers
R,
through
Rj,
the
correlation
coefficient
r is
calculated
by
pressing
(5.r].
The
number
that
appears
in
the
displayed
X-register
will
be
a
§
value
(meaningless,
unless
you
keyed
in
a
specific
x-value,
as
described
above).
To
view
the
correlation
coefficient
value
(r),
exchange
the
contents
of
the X-
and
Y-registers
by
pressing
[x=].
Recall
from
the
discussion
of
LAST
X
in
section
2
that
(3],
[s],
and
do
not
place
a
copy
of
the
x-value
in
the
LAST
X
register.
However,
because
y
is
calculated
from
the
value
in
the
displayed
X-register,
when
you
press
[f][j.r],
a
copy
of
the
x-value
is
placed
in
the
LAST
X
register
and
the
stack—in
all
cases—Ilifts
only
once.

Table of Contents

Questions and Answers:

Question and Answer IconNeed help?

Do you have a question about the HP HP-11C and is the answer not in the manual?

HP HP-11C Specifications

General IconGeneral
BrandHP
ModelHP-11C
CategoryCalculator
LanguageEnglish

Related product manuals