4. Change Zoom in Spectrum Graph (Example)
For example, 1550 MHz is the default frequency in the spectrum graph. If you
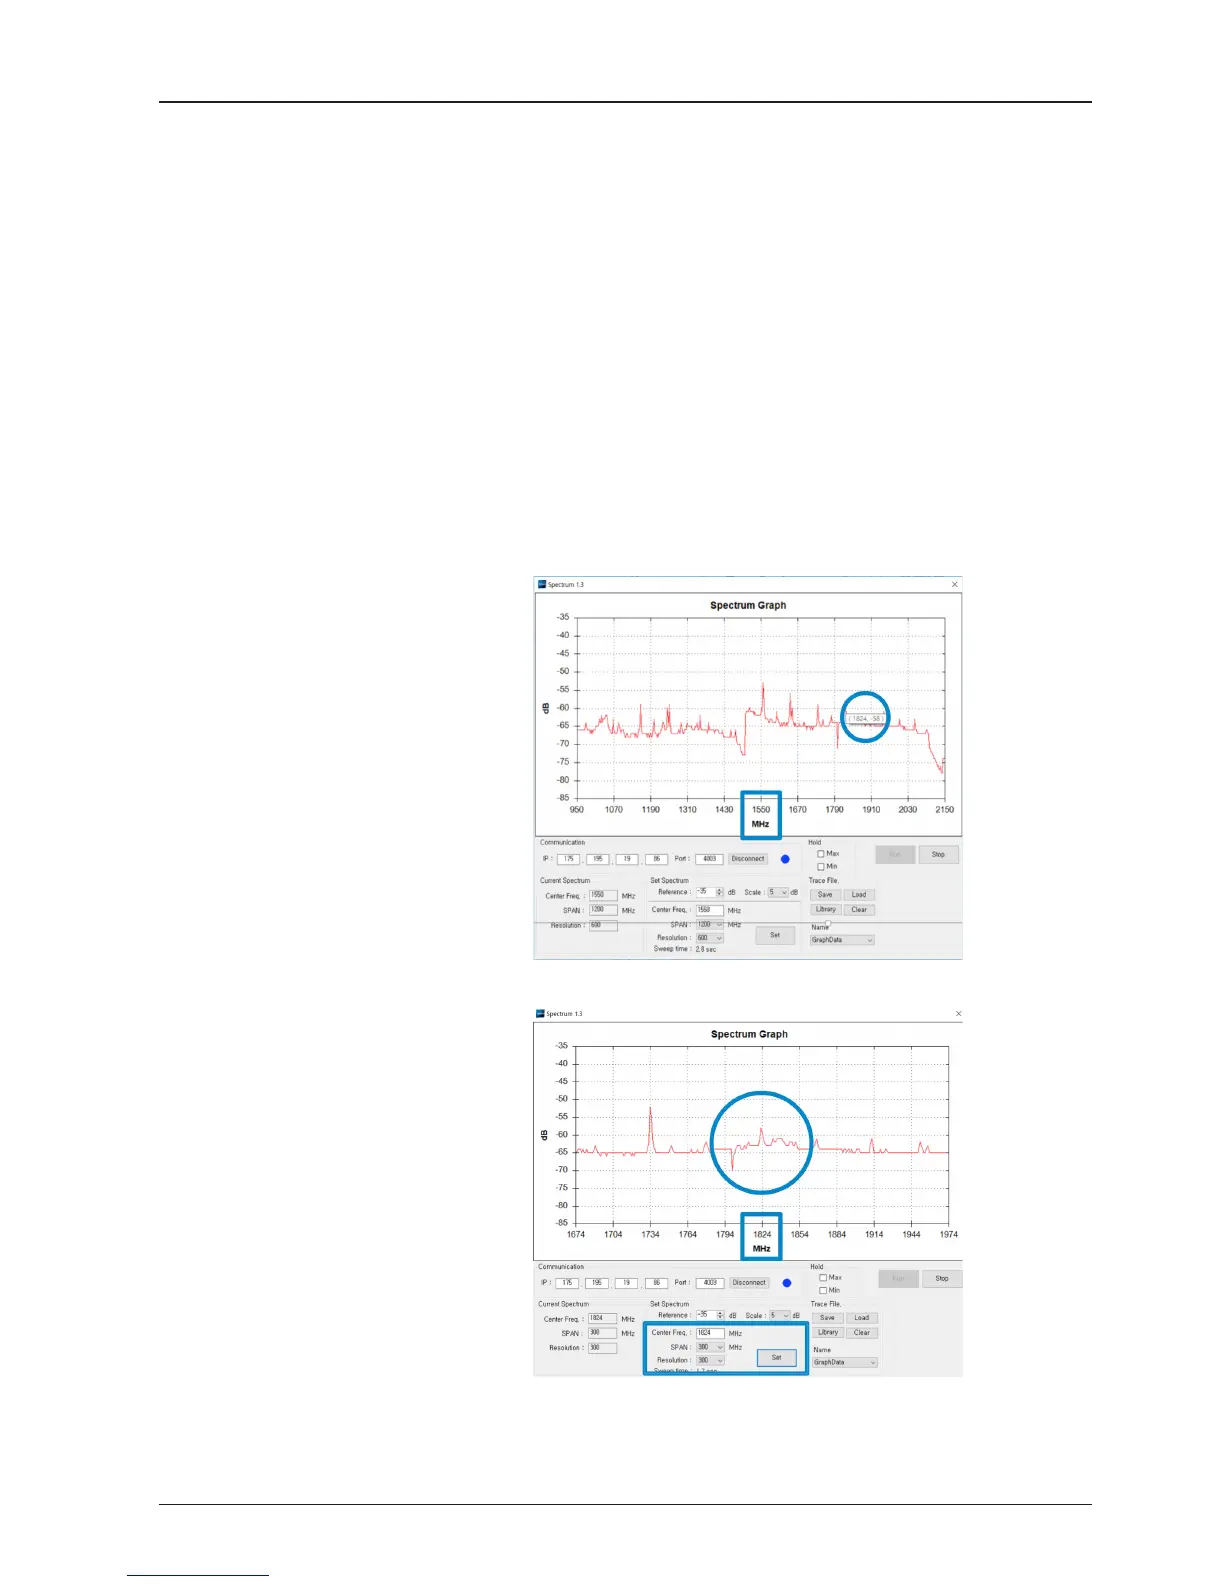
wish to base the spectrum graph on 1824 MHz, follow these steps:
1. Adjust Center Freq. to the desired value. (e.g. 1824 MHz)
2. Adjust Span value to the desired value. (e.g. 300 MHz)
3. Adjust Resolution to the desired value. (e.g. 300)
4. Click the Set button to apply the adjusted values. Verify the spectrum graph is
now displayed using the desired values.
Spectrum Analyzer Graph using defaults
Zoom in Spectrum Analyzer Graph

 Loading...