Keysight N2791A/N2891A High-Voltage Differential Probes User Guide 21
N2891A Plots
N2891A Plots
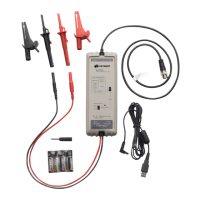
Figure 9 Graph of normalized step response (50 Ω, 10 ns rising edge step genera-
tor), 10 ns normalized rising edge (10-90%), 100:1 attenuation
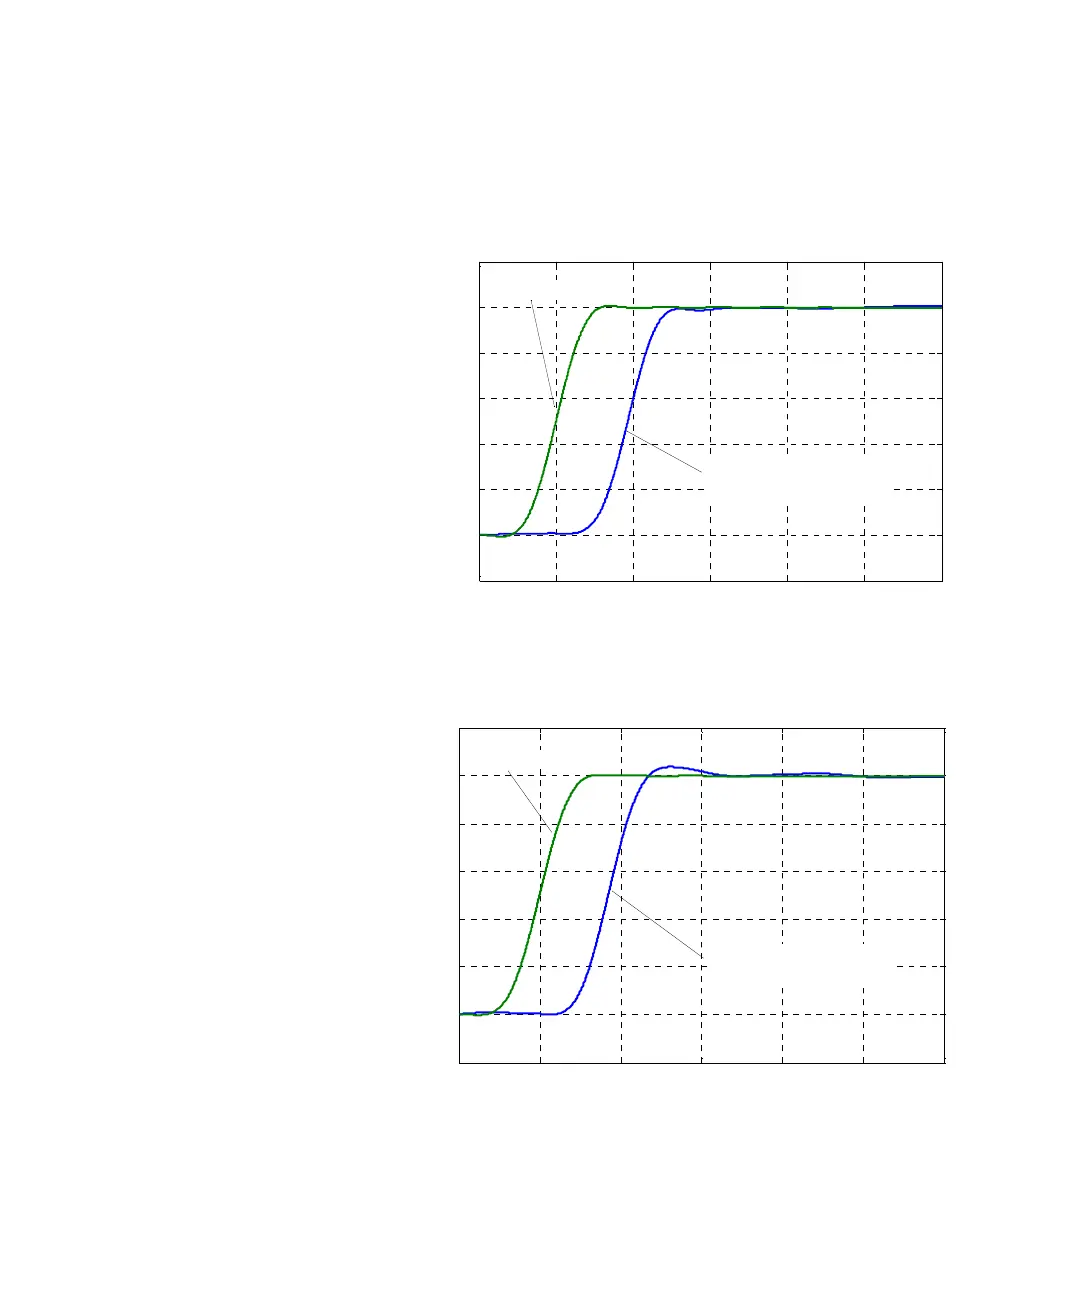
Figure 10 Graph of normalized step response (50 Ω, 10 ns rising edge step genera-
tor), 10 ns normalized rising edge (10-90%), 1000:1 attenuation
-20 0 20 40 60 80 100
-0.2
0
0.2
0.4
0.6
0.8
1
1.2
Time (nS )
Normalized Step Response (V)
Step Input Signal
Probe Step Response
(10 ns 10-90% rise time)
-20 0 20 40 60 80 100
-0.2
0
0.2
0.4
0.6
0.8
1
1.2
Time (nS )
Normalized Step Response (V)
Step Input Signal
Probe Step Response
(10 ns 10-90% rise time)