Title of this help project17
© 2003 Klein Instruments Corporation
You may also choose to examine other databases, from the Archive folder for example, by pressing the
"Choose New DataBase" button.
The data shown is ALL the data in the database, and there may be many Models, Dates shown. To see
only a subset of the data, in the "Sort Data By" pull down lists, select only the data you wish to see,
whether it be from a single Model, or Work Order Number, etc.
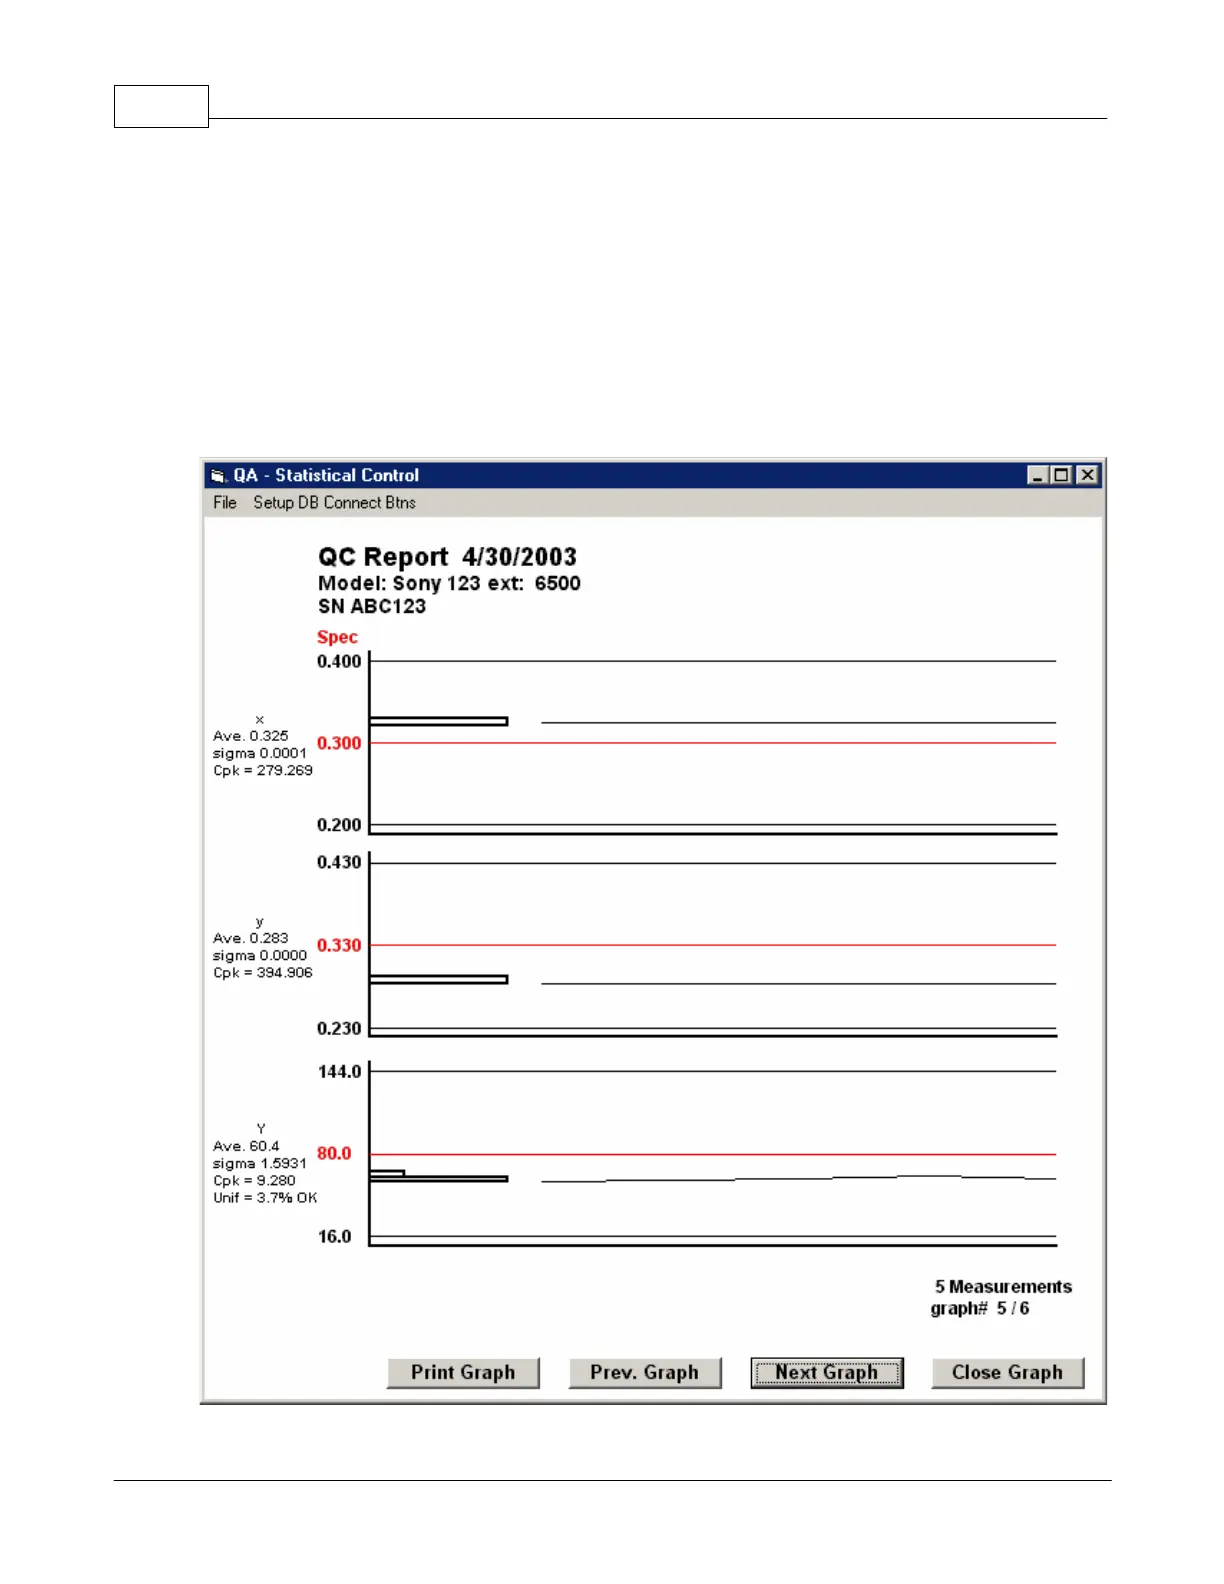
When the "Draw Graphs" button is pressed, a QC graph is drawn for the xyY (or u'v'Y) data of each
different Model, each different White Point Spec file extension.The graphs will show how many units are
within spec, how close to the spec edge they are, and in which direction. Each graph will include Cpk
data to keep track of process control.