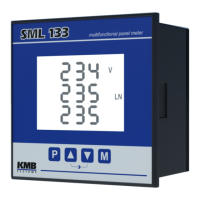
2.2 Measured Data
The instrument starts display actual measured values on power-up. The screen that was selected before the last powerdown
is displayed. You can navigate through all of measured and evaluated values with , and buttons as shown on
the Measured Data Navigation Chart below.
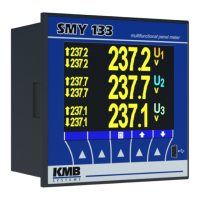
If phase values displayed, individual L1 / L2 / L3 - phase value is shown in the line 1 / 2 / 3. If a three-phase value is
displayed, it is shown in the line 2 and the Σ symbol appears.
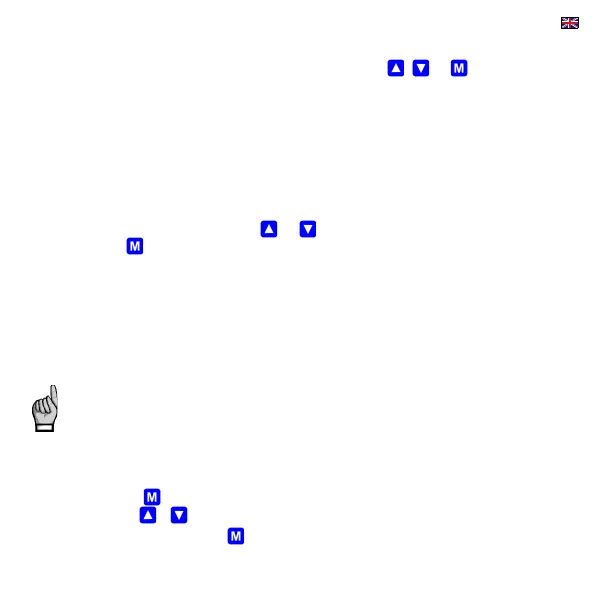
Most of data are arranged in four columns :
• Actual …. actual values, refreshed each 3 measurement cycles (30/36 mains cycles)
• Avg …...... average values per appropriate averaging period (see below)
• AvgMax ... maximum of the avg-value reached since the last clearing
• AvgMin …. minimum of the avg-value reached since the last clearing
You can scroll inside a column down and up with the and keys and move horizontally from a column to the next right
one cyclically with the key.
Exception : Only actual values of harmonics and electrical energy are available. These values are arranged in different way –
see further below.
2.3 Average Values
Average values are processed according set averaging method and length of averaging window (individually for “U/I”-group
and “P/Q/S”-group of quantities). Maximum and minimum values of them are registered into the instrument's memory. The
maximums are displayed in the “AvgMax” column and they are identified with the ▲symbol in the front of the value.
Analogically, the minimums in the “AvgMin” column are identified with the ▼symbol.
Neither maximum nor minimum of cosφ values are evaluated due to special character of the quantity. Similarly,
these extreme values are not evaluated at harmonics
You can clear the “AvgMax”/“AvgMin” values. All of the maximums/minimums of appropriate quantity group are cleared
simultaneously. To do it, follow next :
• navigate on corresponding AvgMax or AvgMin value
• press the key until the value starts flashing
• with the or key, choose the C L r option
• then confirm by pressing the