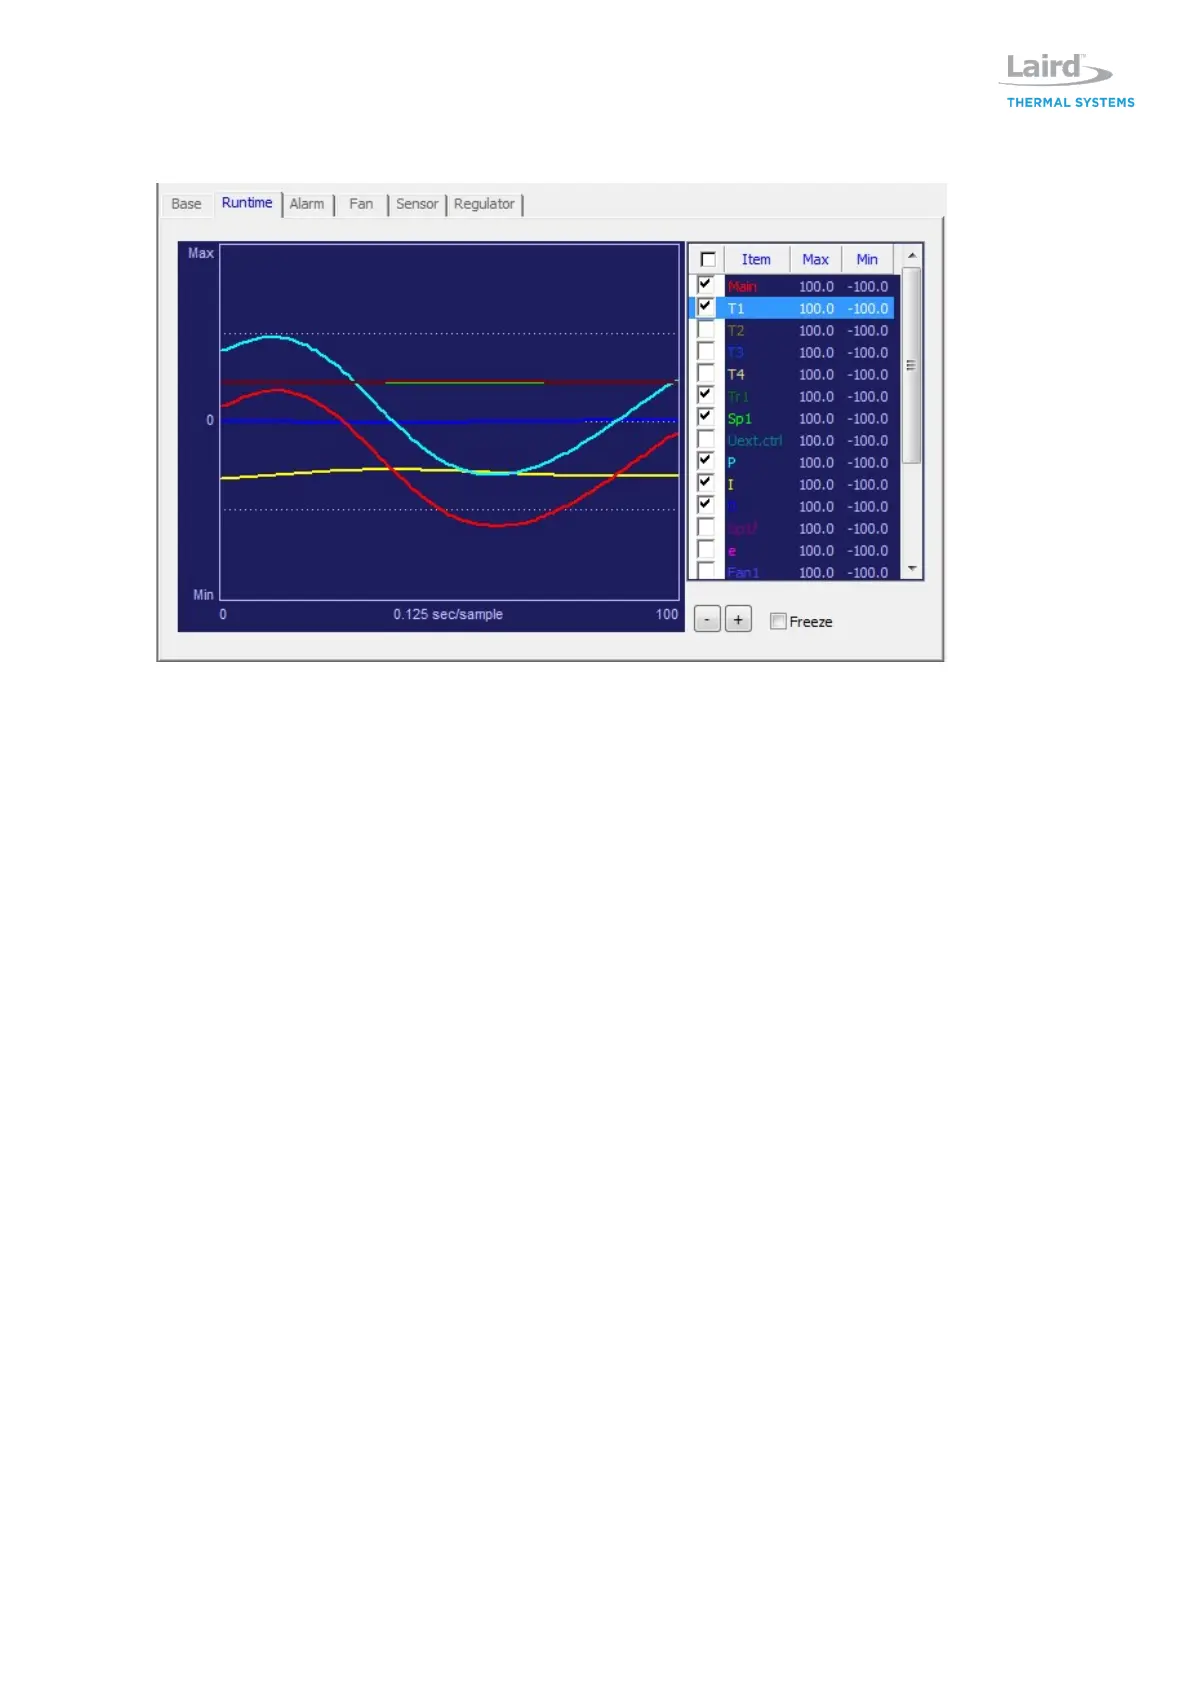
5.2 Runtime
Runtime tab allows user to visually monitor operation parameters of controller. A live running time
scale graph appears that allows user to view main power, thermistors, temperature set points, input
current draw, input voltage to TEMs, input power to fans and PID parameters.
The live data graph is updating data continuously when connected to the regulator board. The speed
can be adjusted by pushing [+] or [-] buttons. The view can be frozen by clicking on the freeze box.
The run time view dialog can be increased by double clicking on the graph view and adjusting size.
The graph view will remember the data of each graph parameter, so it is possible to click on the
enable/disable part of the list to change the graph line and turn on or off.
If you want to change the colors on the graph or line thickness, open the global setup and change the
settings, ref section 3.3.
The items on the right are a selection of the parameters viewable in the graph. Double click on each
parameter to adjust the min/max settings and change the height resolution of the graph. Use the UP
and DOWN arrow to move up and down the list. Press space bar to toggle visibility state of selected
row.
 Loading...