26
Regression Statistics
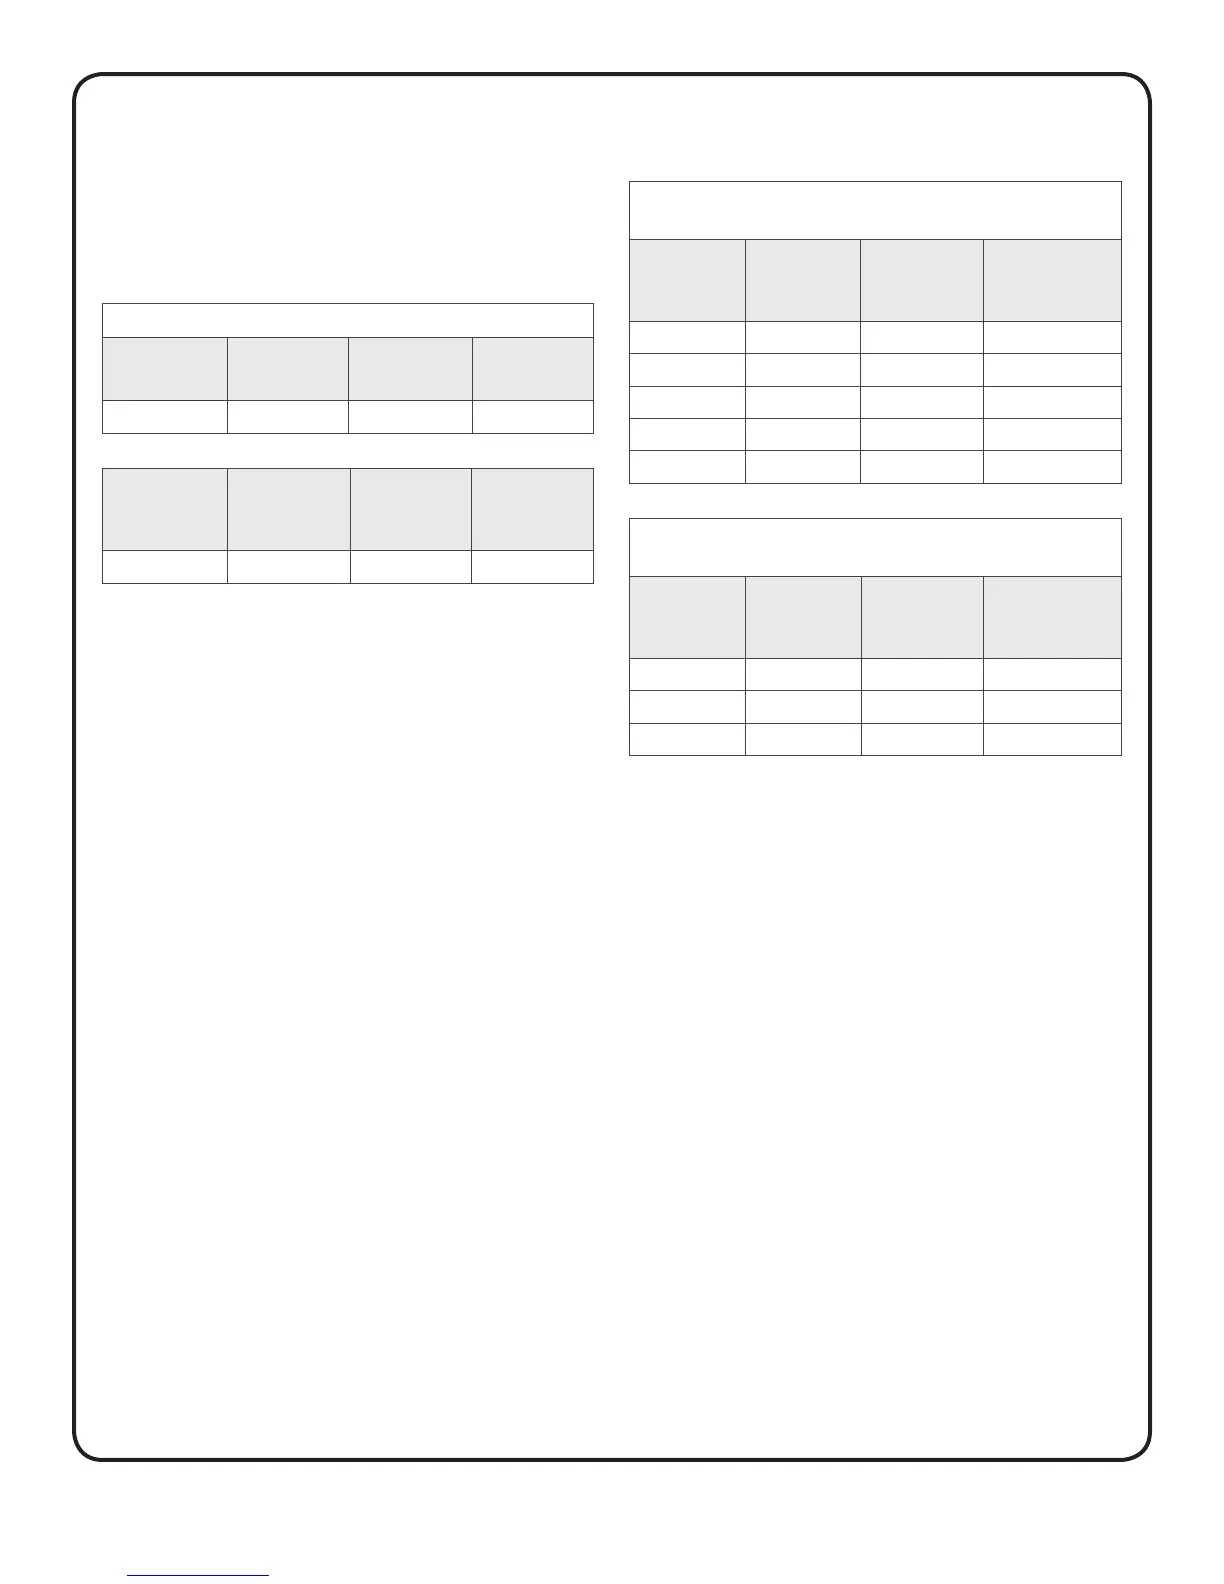
Samples were tested in duplicate on each of three test strip
lots. Results indicate that the OneTouch® SelectSimple™ Meter
compares well with a laboratory method.
Summary of Regression Analysis
Number
of Subjects
Number
of Tests
Slope Intercept
(mg/dL)
100 600 0.959 -0.785
95% CI
Slope
95% CI
Intercept
(mg/dL)
Std. Error
(S
y.x
)
(mg/dL)
R
2
0.951 to 0.967 -2.488 to 0.917 11.054 0.989
Precision
Within Run Precision/Repeatablity (100 Venous Blood Tests)
Target
Glucose
(mg/dL)
Mean
Glucose
(mg/dL)
Standard
Deviation
(mg/dL)
Coefficient of
Variation
(%)
40 39.0 1.64 4.20
100 102.2 2.26 2.21
130 122.9 2.92 2.38
200 205.6 3.65 1.77
300 312.2 4.36 1.40
Total Precision
(200 control solution tests)
Glucose
Level
(mg/dL)
Mean
Glucose
(mg/dL)
Standard
Deviation
(mg/dL)
Coefficient of
Variation
(%)
Low 45.4 1.35 2.96
Normal 117.1 2.52 2.15
High 343.0 7.64 2.23