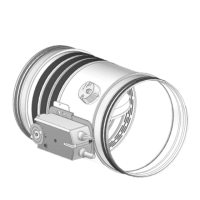
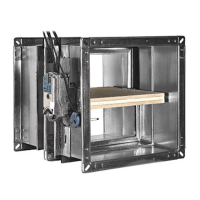
SELECTION
WH25
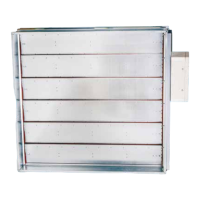
LINDAB SAFE
40/50
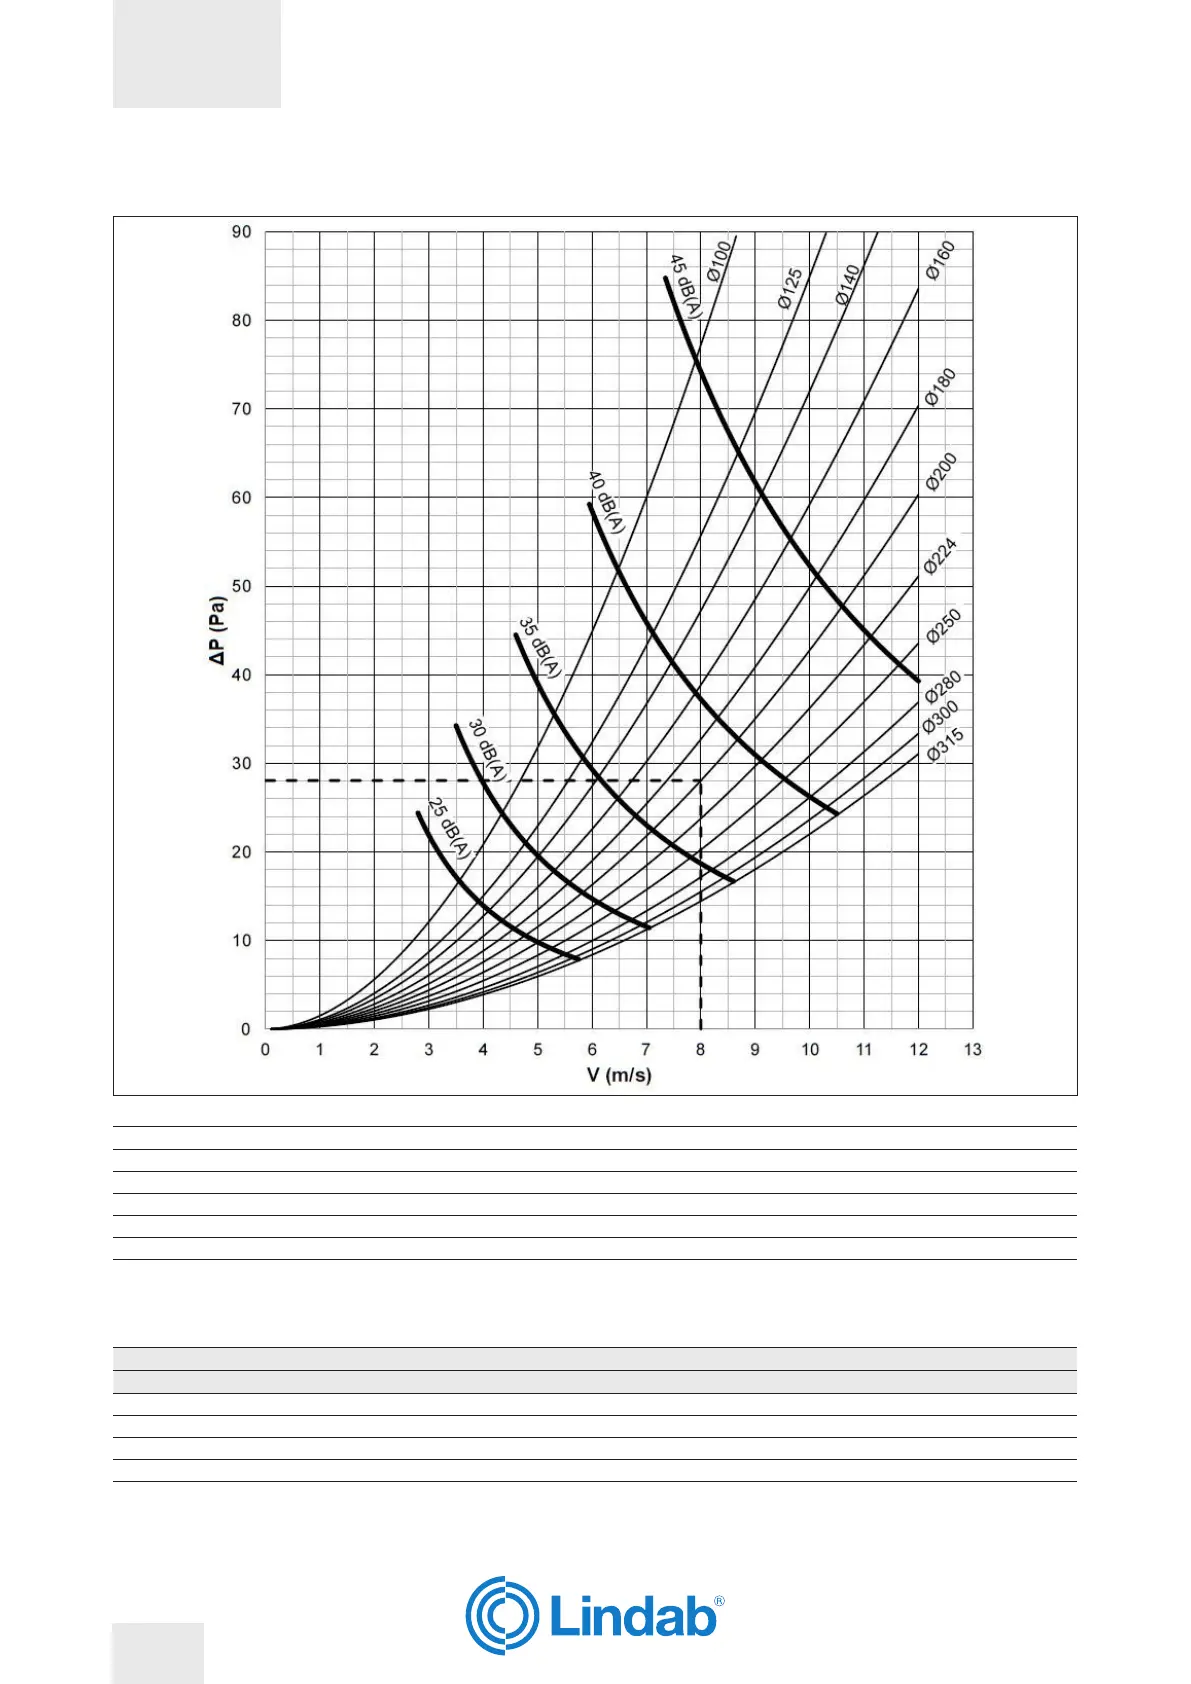
Pressure drop and sound level graph
Example
Ø = Diameter [mm] Ø = 200 mm
Q = Air ow [m³/h] Q = 900 m³/h
V1 = Frontal air speed [m/s] V1 = 8 m/s
ΔP = Pressure drop [Pa] From graph: ΔP = 28 Pa
Lw = Sound level [dB(A)] From graph: Lw = 38 dB(A)
Sound spectrum table
Correction used to estimate the octave band spectrum (Values to be added to the noise levels in dB(A))
Frontal speed Frequency Hz
m/s 63 125 250 500 1000 2000 4000 8000
6 15 7 4 -4 -9 -10 -15 -22
9 17 8 5 -4 -9 -10 -19 -20
12 20 9 5 -4 -9 -15 -16 -12
WH25
LINDAB SAFE
40/50