3
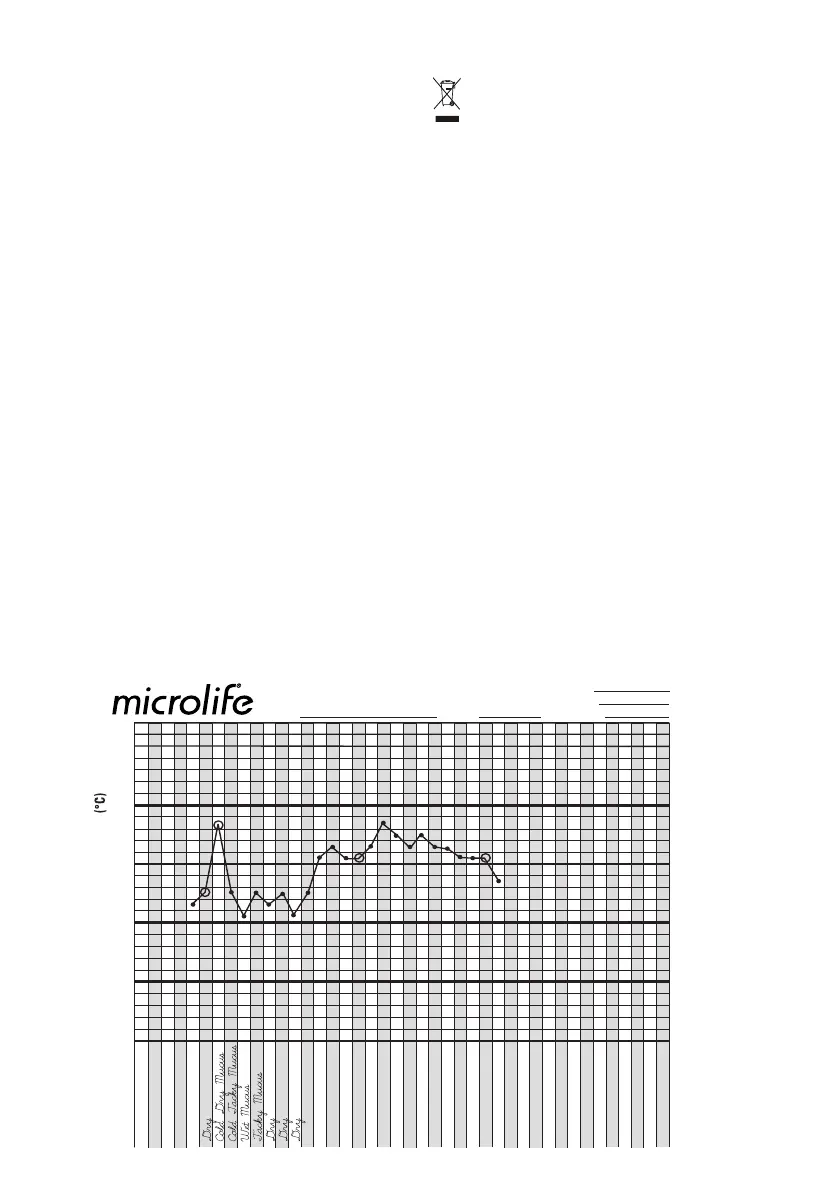
tracking charts enclosed. Prepare your chart following the example.
Day 1 for each cycle is the first day of menstruation /
«Period». Above the pre-printed days of the cycle enter correspond-
ing calender dates. During your menstrual flow, it is not necessary to
record temperature (unless you have short cycles). Instead, mark an
X in each space provided to indicate the number of days your period
lasts. Begin recording your basal temperature the first morning fol-
lowing your peroid.
For each daily temperature, trace down the column below the cycle
day until it intersects with your recorded temperature. Place a dot at
the intersection. A notation should be made for any rise in tempera-
ture due to illness, emotional stress, or sleeplessness. Intercourse
can be indicated by placing a circle around the dot of the appropriate
day. Chart your readings for at least three months in order to be sure
that you have determined your approximate time of ovulation during
any regular menstrual cycle. Careful temperature recording will help
establish your particular pattern. Completed charts should then be
presented to your physician or family planning counselor, who will
assist you in accurately interpreting your results.
HOW TO INTERPRET THE BASAL BODY TEMPERATURE
(BBT) CURVE
Let’s follow the sample BBT curve on this page to help better interpret
typical results. «Jane Smith» has noted the last 4 days of her period
with «X». Day #4 was Jane’s last day of menstrual flow so on day #5
she recorded her temperature as 36.33 °C and made a «•» mark
on the chart. On day #6 Jane’s temperature rose only 0.04 °C to
36.37 °C. On day #7 her temperature rose to 36.67 °C, a full 0.3 °C
increase in one day. This increase in temperature can be caused by
hormonal changes that occur in your body 12-24 hours before your
ovary releases an egg. This helps identify the best time to increase
your likelihood of becoming pregnant. Note Jane timed intercourse
with the rise in temperature on day #6 and #7 as indicated by a «•».
Jane’s temperature dropped back to 36.38 °C the day following ovula-
tion and remained consistent through day 14. On day 15 through
28, Jane’s temperature rose and remained elevated. This second rise
during her cycle is likely related to our body’s release of the hormone
progesterone. This hormone prepares your uterus for a fertilized egg.
If you don’t become pregnant, the level of progesterone falls so your
temperature does too and your cycle begins again with the start of
Upuszczenie). Skontaktuj się z lokalnym serwisem
«Microlife», aby umówić się na test.
OSTRZEŻENIE: Nie należy narażać baterii na
działanie ekstremalnych temperatur ponieważ mogą
one eksplodować.
Zużyte baterie oraz urządzenia elektryczne muszą
by poddane utylizacji zgodnie z obowiązującymi przepisa
-
mi. Nie należy wyrzucać ich wraz z odpadami domowymi.
ZAPISYWANIE TEMPERATURY BAZOWEJ
Proszę odnieść się do pola próbki, aby śledzić bazową
tempera-turę. Przygotuj swój wykres według przykładu.
Dzień 1 każdego cyklu to pierwszy dzień miesiączki / okre
-
su. Na górze wpisz datę kalendarzową, a pod datą wpisz
odpowiedni dzień z kalendarza. W trakcie cyklu miesiączki
nie jest konieczne rejestrowanie temperatury (chyba że
okres jest bardzo krótki). Oznaczaj to umieszczeniem X w
każdym polu odpowiadającym kolejnym dniom miesiączki.
Zacznij kontrolowanie swojej bazowej temperatury ciała aż
do następnego ranka po zakończeniu miesiączki. Należy
wskazać różnice w temperaturze z powodu choroby, stresu
lub bezsenności. Zapisuj odczyty regularnie, przez co
najmniej trzy miesiące, w celu ustalenia przybliżonego
okresu owulacji podczas każdego cyklu miesiączkowego.
Staranna kontrola temperatury pozwoli na stworzenie
wzorca, który powinien być dostarczony lekarzowi celem
właściwej interpretacji wyników.
JAK INTERPRETOWAĆ WYNIKI TEMPERATURY
Weźmy pod uwagę krzywą BBT próbki na poprzedniej
stronie aby lepiej zinterpretować typowe wyniki. «Jane
Smith» zapisywała temperaturę przez 4 ostatnie dni z jej
okresu «X».
Dzień # 4 był dla Jane ostatnim dniem menstruacji, więc
w dniu 5 zapisała swoją temperaturę - 36,33 °C i zrobiła
znak «•» na wykresie. Dzień #6 dnia temperatura Jane
wzrosła tylko o 0,04 °C do 36,37 °C. Dzień #7 temperatura
wzrosła do 36,67 °C. Wzrost ten może być spowodowany
przez hormonalne zmiany, które zachodzą w organizmie
w ciągu 12-24 godzin przed czasem, kiedy jajnik uwal
-
nia komórkę jajową. Pomaga to określić najlepszy czas
zwiększenia prawdopodobieństwa zajścia w ciążę. Uwaga
w czasie współżycia temperatura Jane wzrosła w dniu
# 6 i # 7 co zostało zaznaczone na wykresie symbolem
1 2 3 4 5 6 7 8 9
10
11 12 13 14 15 16 17 18 19 20
21
22 23 24 25 26 27 28 29 30 31
32
33 34 35 36 37 38 39 40 41 42
Data
Dzień cyklu
Obserwacje
Poprzedni cykl: Najdłuższy
Najktótszy
Nazwisko: Miesi
ąc: Obecny:
Jane Smith
May
35
28
29
x x x x
x x x x
•
•
• •
37.00
33.95
33.90
33.85
33.80
33.75
32.70
32.65
32.60
32.55
32.50
32.45
32.40
32.35
32.30
32.25
32.20
32.15
32.10
32.05
36.00
36.95
32.90
32.85
32.80
35.75
37.00
.95
.90
.85
.80
.75
.70
.65
.60
.55
.50
.45
.40
.35
.30
.25
.20
.15
.10
.05
36.00
.95
.90
.85
.80
.75
6 7 8 9 10 11 12 13 14 15 16 17 18 19 20 21 22 23 24 25 26 27 28 29 30 31 1 2 3 4 5 6 7
Odczyty temperatury

 Loading...