RECORDING BASAL TEMPERATURE
Please refer to the sample recording and blank temperature
tracking charts enclosed. Prepare your chart following the
e
xample. Day 1 for each cycle is the first day of menstrua-
t
ion/«Period». Above the pre-printed days of the cycle enter cor-
responding calender dates. During your menstrual flow, it is not
necessary to record temperature (unless you have short cycles).
Instead, mark an X in each space provided to indicate the num-
ber of days your period lasts. Begin recording your basal tem-
perature the first morning following your peroid.
For each daily temperature, trace down the column below the
cycle day until it intersects with your recorded temperature.
Place a dot at the intersection. A notation should be made for
any rise in temperature due to illness, emotional stress, or
sleeplessness. Intercourse can be indicated by placing a circle
around the dot of the appropriate day. Chart your readings for
at least three months in order to be sure that you have deter-
mined your approximate time of ovulation during any regular
menstrual cycle. Careful temperature recording will help estab-
lish your particular pattern. Completed charts should then be
presented to your physician or family planning counselor, who
will assist you in accurately interpreting your results.
HOW TO INTERPRET THE BASAL BODY TEMPERATURE
(BBT) CURVE
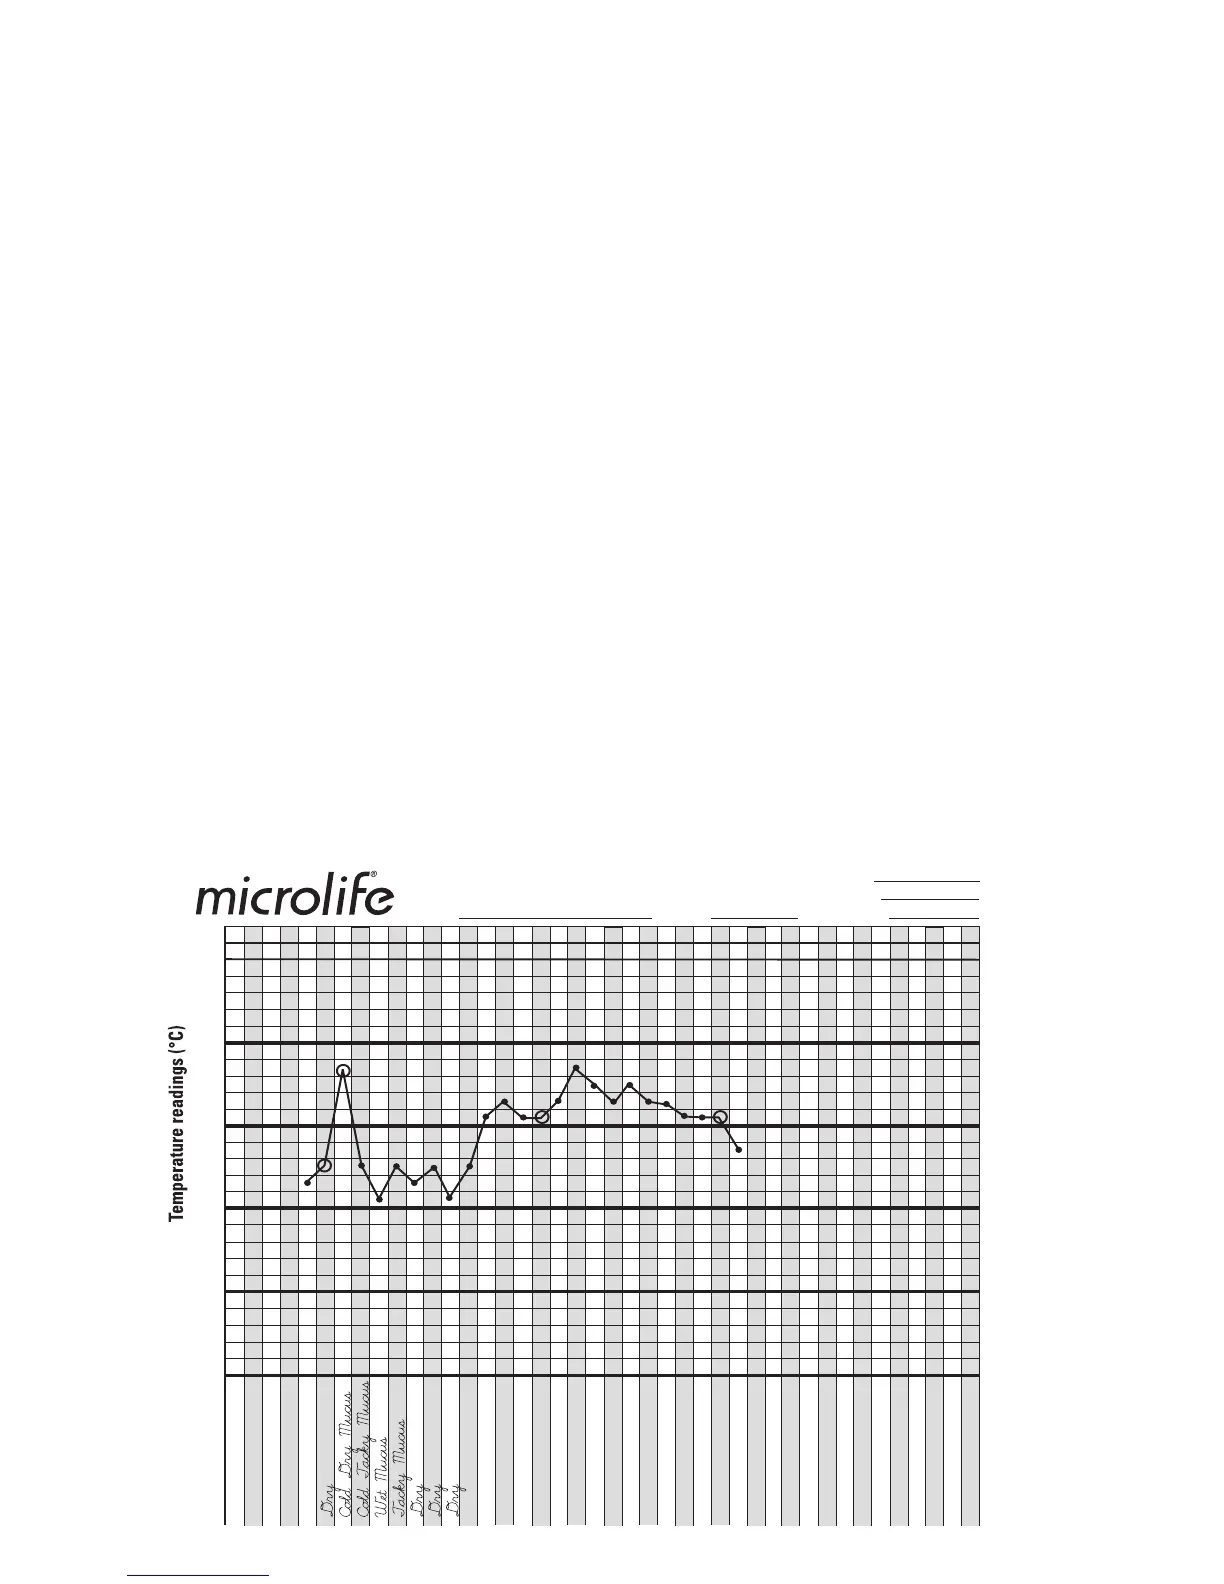
Let’s follow the sample BBT curve on the previous page to
help better interpret typical results. «Jane Smith» has noted
the last 4 days of her period with «X». Day #4 was Jane’s last
day of menstrual flow so on day #5 she recorded her tempera-
ture as 36.33 °C and made a «•» mark on the chart. On day
#6 Jane’s temperature rose only 0.04°C to 36.37 °C. On day
#7 her temperature rose to 36.67 °C, a full 0.3 °C increase in
one day. This increase in temperature can be caused by hor-
monal changes that occur in your body 12-24 hours before
CONTROL DE LA TEMPERATURA BASAL
Por favor refiérase al cuadro de ejemplo para llevar control de la
temperatura basal. Prepare su cuadro siguiendo el ejemplo. Día 1
d
e cada ciclo es el primer día de su menstruación/período. Arriba
d
e los días pre-impresos, coloque las fechas del calendario corre-
spondientes. Durante su etapa menstrual, no es necesario anotar
la temperatura (a menos que tenga ciclos muy cortos). En vez,
coloque una X en cada cuadro para indicar el número de días que
tarda su periodo. Empiece a anotar su temperatura basal a la
siguiente mañana luego del final de la menstruación.
Por cada temperatura diaria, trace una raya en la columna del
día del ciclo hasta que intercepte la temperatura adquirida.
Coloque un punto en la unión. Una anotación debe ser indicada
por cualquier variación de la temperatura debido a enfermedad,
estrés emocional, o insomnio. Relaciones sexuales pueden ser
indicadas con un círculo alrededor del punto del día apropiado.
Anote su lectura por lo menos durante tres meses para tener por
seguro que ha determinado su tiempo aproximado de ovulación
durante cualquier ciclo regular menstrual. El control cuidadoso de
temperatura ayudará a establecer un patrón particular. Los cuad-
ros deberían entonces ser llevados a su doctor o asesor en pla-
neación familiar para la interpretación precisa de los resultados.
COMO INTERPRETAR LA CURVA DE TEMPERATURA
BASAL CORPORAL (TBC)
Tomemos como ejemplo la TBC en la página anterior para ayudar-
nos a interpretar los resultados típicos. «Jane Smith» ha marcado
los últimos 4 días de su periodo con «X». El día #4 es el último día
en el que Jane presenta flujo menstrual, así que en el día #5 anota
la temperatura 36.33 °C marcando la gráfica con el símbolo «•». En
el día #6 la temperatura de Jane se incrementó solo 0.04 °C, lle-
gando a los 36.37 °C. En el día #7 su temperatura subió a 36.67 °C,
es decir, un incremento de 0.3 °C en tan solo un día. Este incremen-
to de la temperatura puede ser ocasionado por cambios hormona-
 Loading...