should be adjusted.
F. The pie chart in the Aware or Not Aware Section displays the percentage of aware states
your meter has entered since activation.
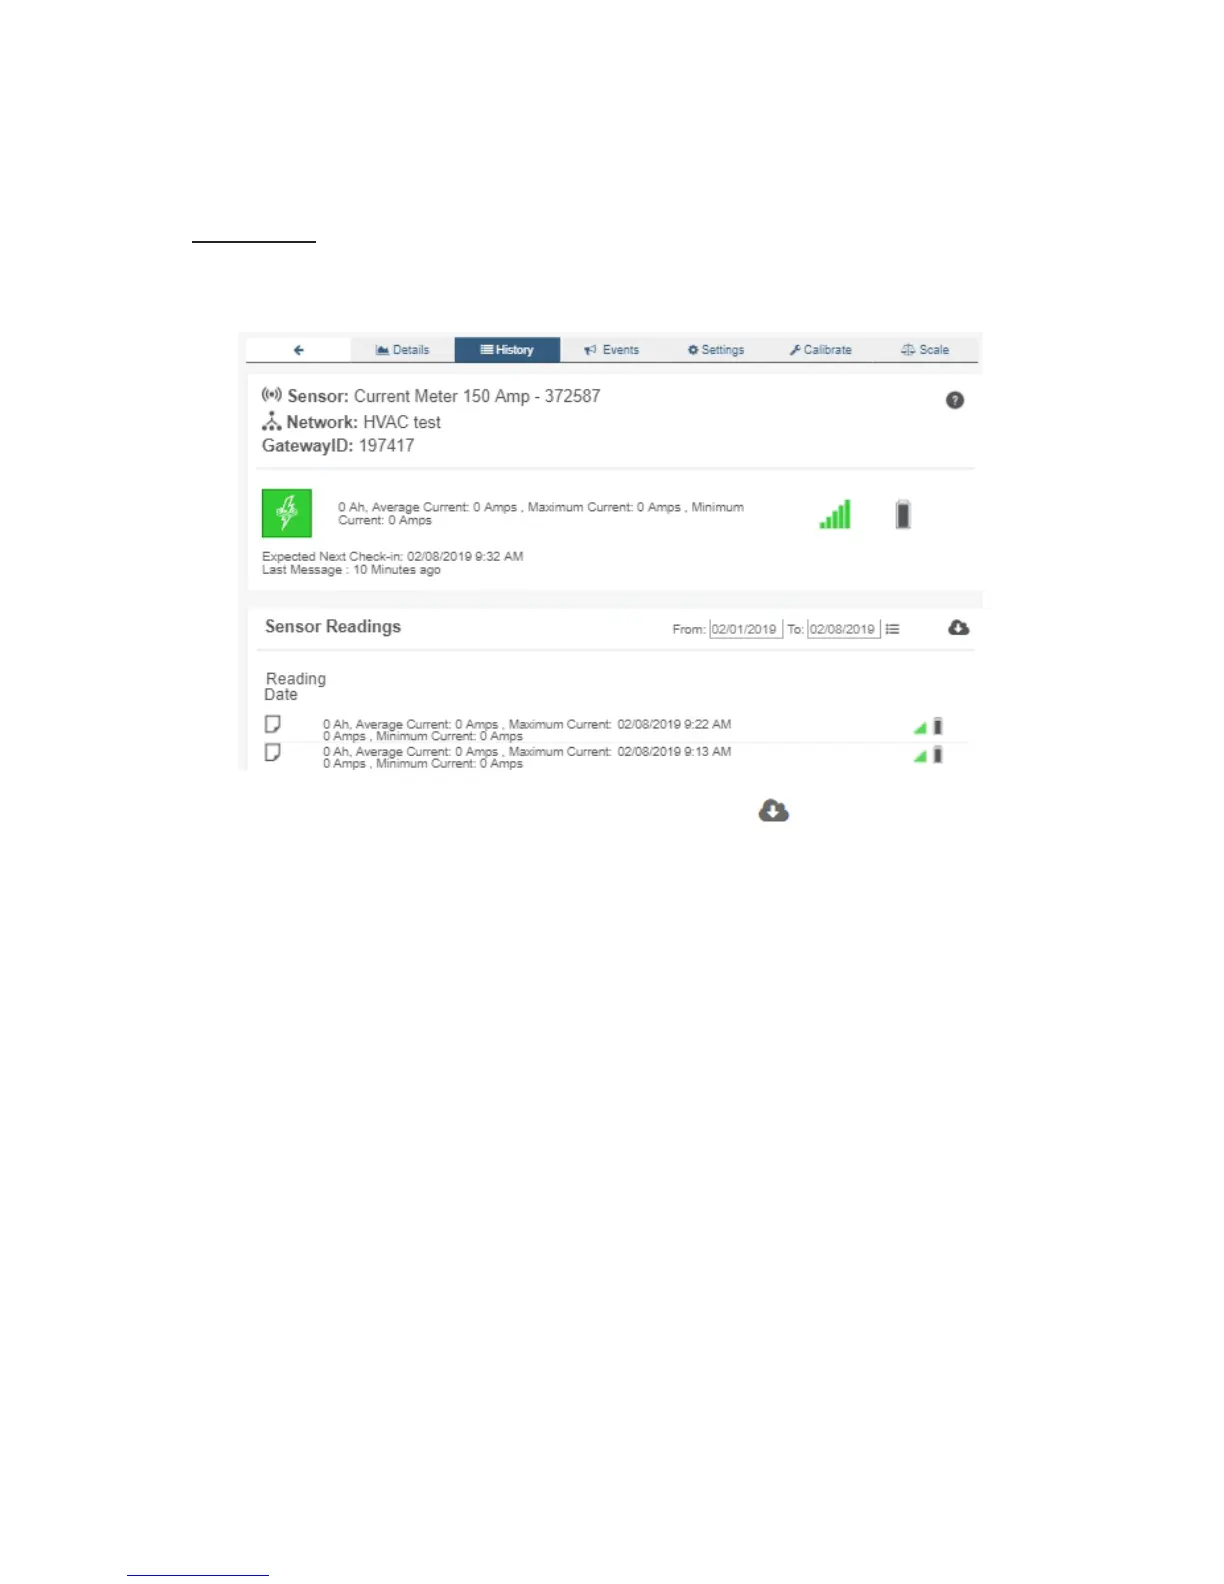
History View
Selecting the “History” tab within the tab bar allows you to view the meter’s data history as
time stamped data.
• On the far right of the meter history data is a cloud icon. Selecting this icon will
export an excel le for your sensor into your download folder.
Note: Make sure you have the date range for the data you need input in the “From” and “To” text boxes. This will be
the most recent week by default. Only the rst 2,500 entries in the selected date range will be exported.
The data le will have the following elds:
MessageID: Unique identier of the message in our database.
SensorID: If multiple meters or sensors are exported you can distinguish which reading
was from which using this number even if the names for some reason are the same.
Sensor Name: The name you have given the meter.
Date: The date the message was transmitted from the meter.
Value: Data presented with transformations applied but without additional labels.
Formatted Value: Data transformed and presented as it is shown in the monitoring portal.
Battery: Estimated life remaining of the battery.
Raw Data: Raw data as it is stored from the sensor.
Sensor State: Binary eld represented as an integer containing information about the state
or the meter when the message was transmitted. (See “Sensor State Explained” below).
Gateway ID: The Identier of the gateway that relayed the data from the meter.
Alert Sent: Boolean indicating if this reading triggered a notication to be sent from the
system.
Signal Strength: Strength of communication signal between the meter and the gateway,
shown as percentage value.
PAGE 7