Technical Supplement
S-2
S2.3 Measured versus Calculated Saturation
When saturation is calculated from a blood gas measurement of the partial
pressure of arterial oxygen (PaO2), the calculated value may differ from the
NPB-40 SpO2 measurement. This is because the calculated saturation may
not have been corrected for the effects of variables that can shift the
relationship between PaO2 and saturation.
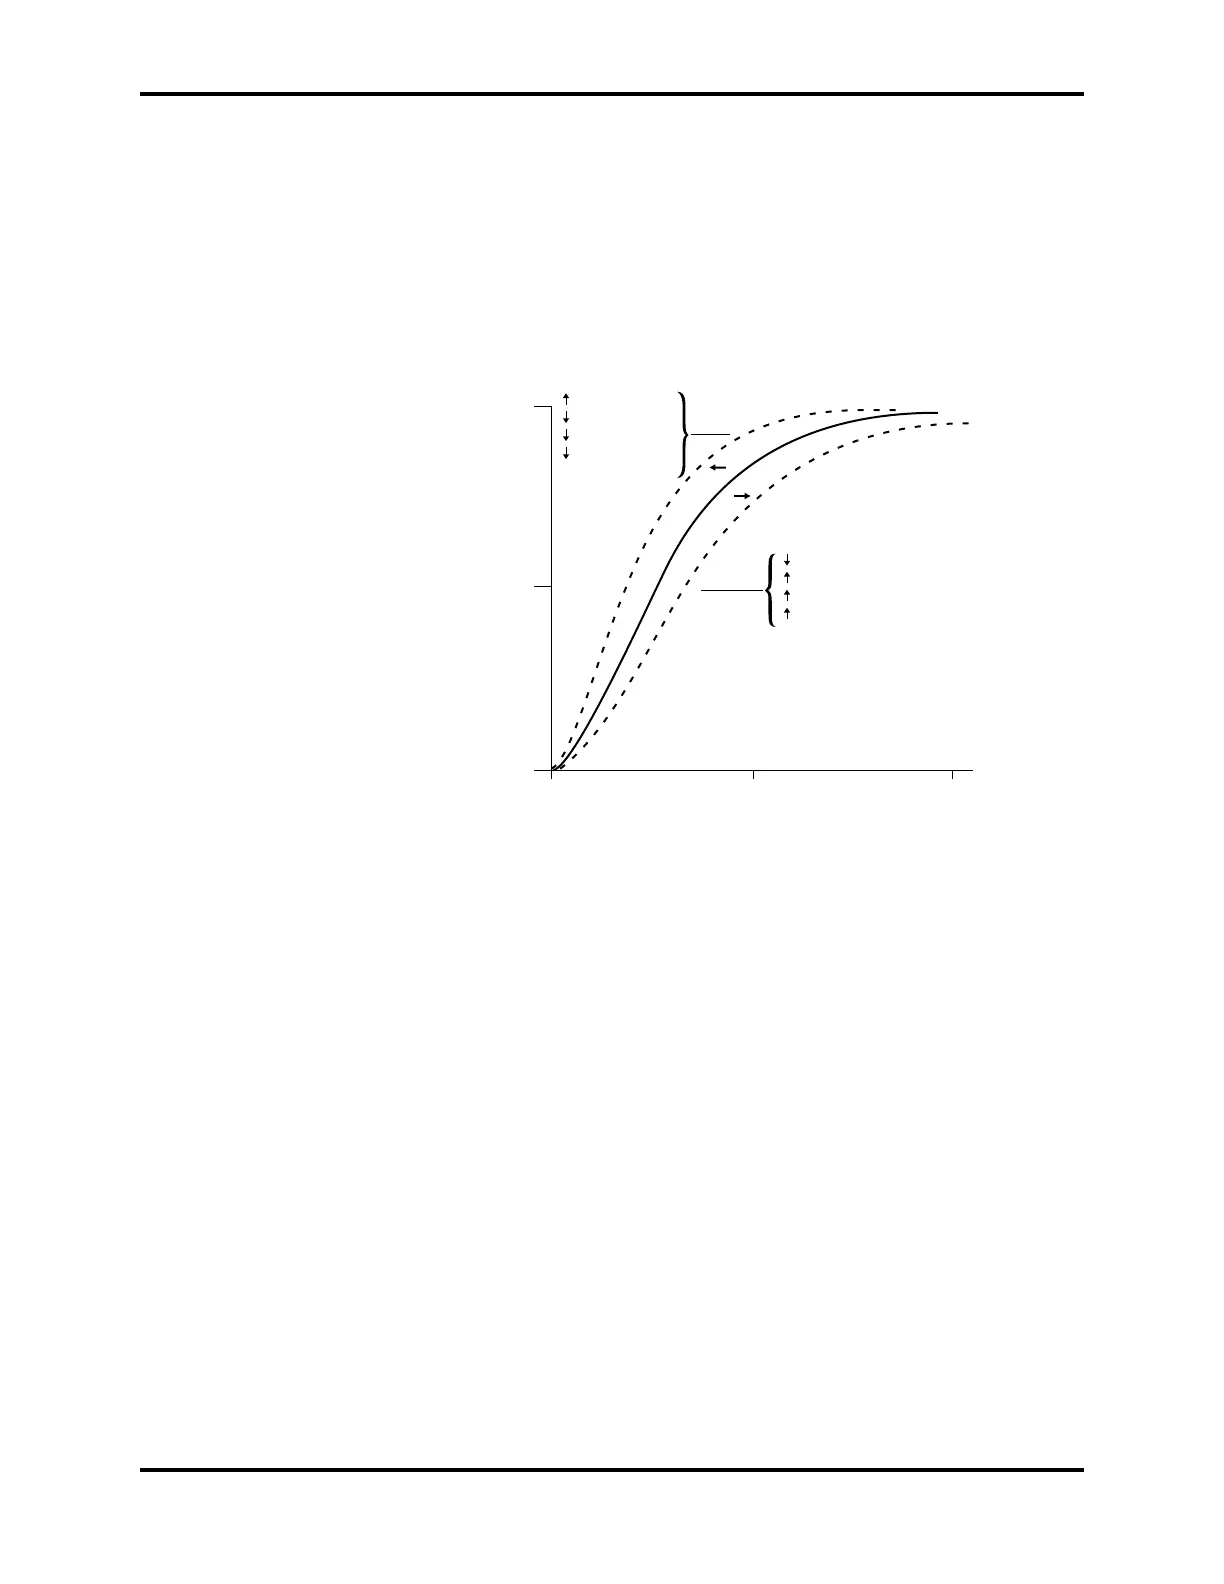
Figure S2-1 illustrates the effect that variations in pH, temperature, partial
pressure of carbon dioxide (PCO2), and concentrations of 2,3-DPG and fetal
hemoglobin may have on the oxyhemoglobin dissociation curve.
0
10050
Saturation (%)
pH
Temperature
PCO
2
2,3-DPG
PO
2
(mmHg)
100
50
pH
Temperature
PCO
2
2,3-DPG
Fetal Hb
Figure S2-1: Oxyhemoglobin Dissociation Curve
S3 CIRCUIT ANALYSIS
This section provides an explanation of NPB-40 theory of operation using
block diagrams and schematic diagrams.
The NPB-40 consists of three main functional components described in the
following paragraphs:
• The CPU PCB block diagram (Figure S3-2) and schematic diagram
(Figure S4-3).
• The LCD PCB block diagram (Figure S3-3) and schematic diagram
(Figure S4-4).
• The Front Panel PCB schematic diagram (Figure S4-5).
The relationship between these components and their interconnection is
illustrated in the NPB-40 block diagram (Figure S3-1).