Advanced Industrial Automation
9
Trend Graphs & Data Logging
Easily log and display any data over time
A variety of graphing functions are built into the NS-series HMI, such
as the trend graph, which can log data over a longer period of time, and
the line graph, which can display overlapping graphs.
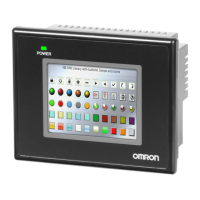
Logging data is stored as a CSV file in the Memory Card mounted in
the NS-series HMI. The data stored in the Memory Card can be read
or deleted from the screen.
Log files can be saved automatically, just by selecting the Save the data periodically Option in the Data Log Setting Window.
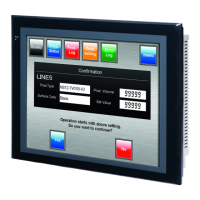
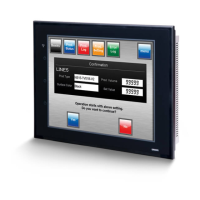
Trend Graph Function
Data stored/logged by the PLC can be displayed in overlapping graphs, so a device's operation can be compared for evaluation and analysis. In
addition, up to 1,000 words of consecutive data can be displayed as a line graph, data can be displayed together, and any region can be magnified.
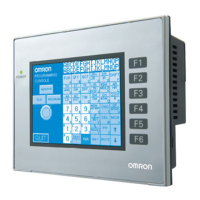
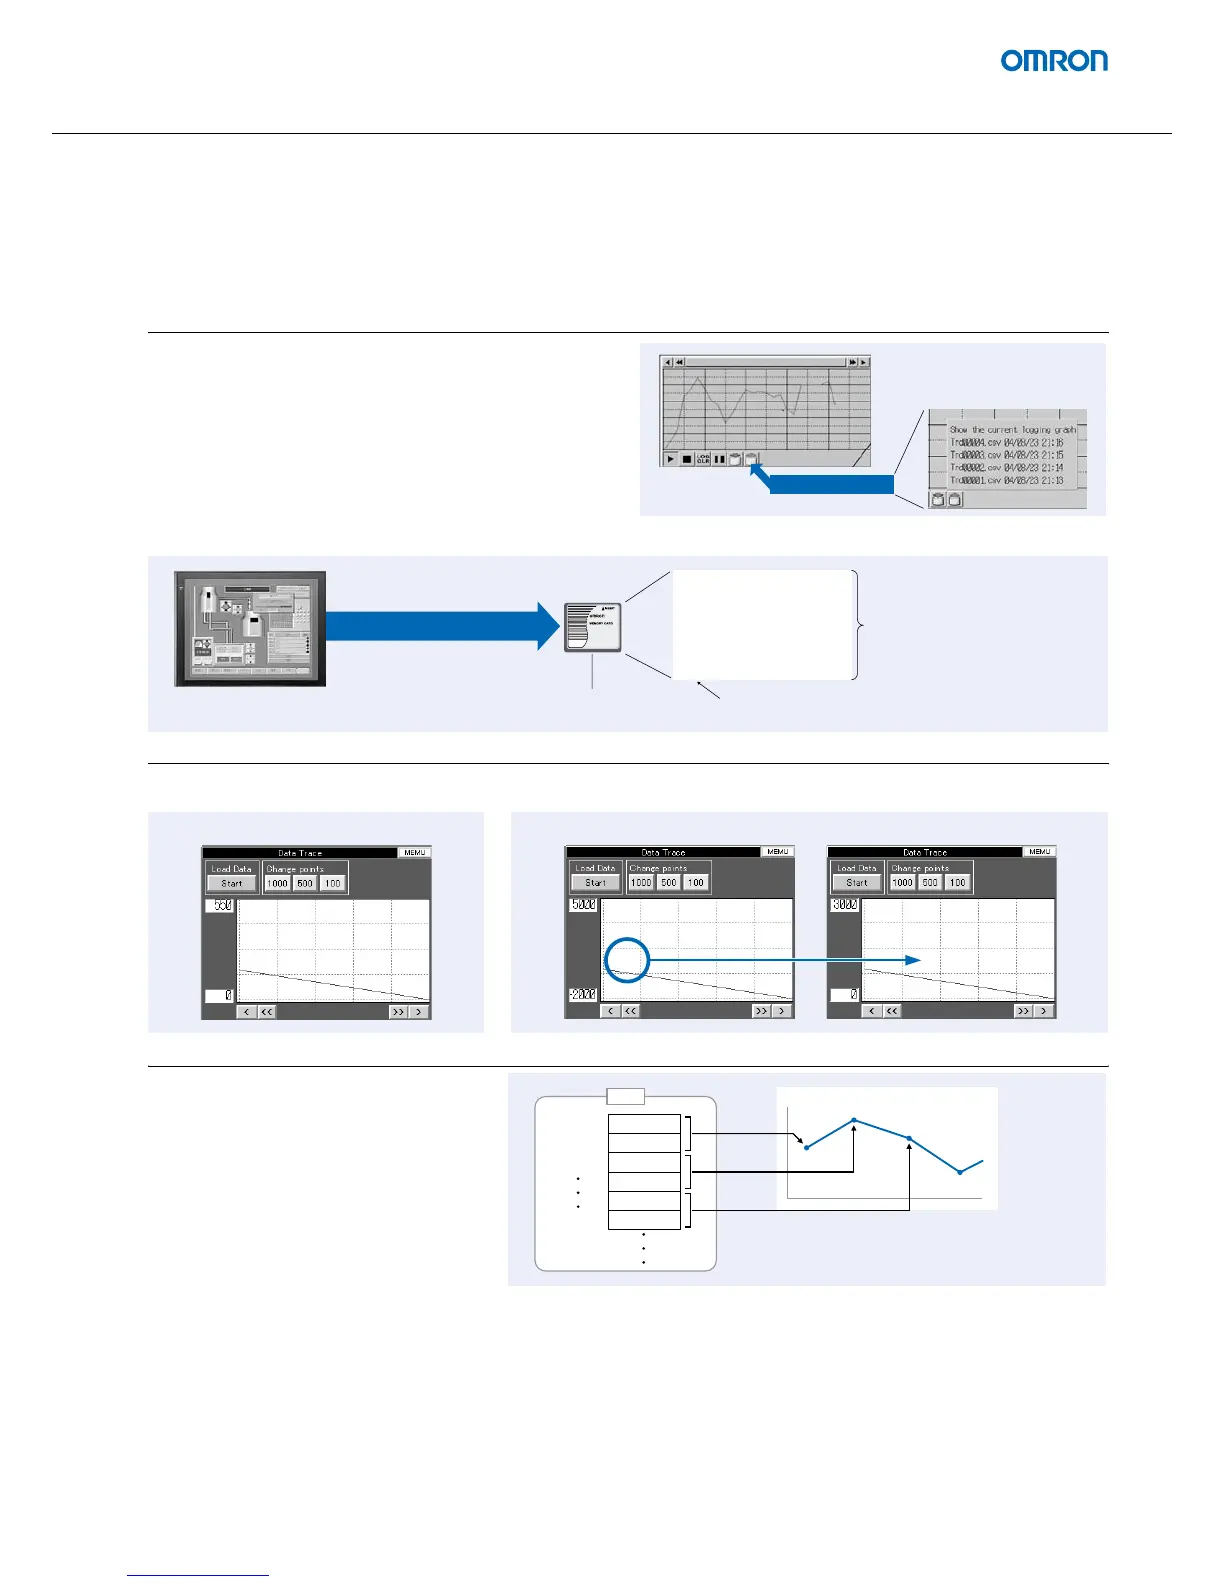
Continuous Line Graph
A graph can be plotted in any position by spe-
cifying the X and Y coordinates of the vertices.
Also, the graph can be moved on the screen by
specifying the movements from the PLC.
Read file button
A list of log files is retrieved
from the memory card and
shown in a popup menu.
LOG001.CSV 04/06/04 10:00
LOG002.CSV 04/06/05 10:00
LOG003.CSV 04/06/06 10:00
LOG004.CSV 04/06/07 10:00
LOG005.CSV 04/06/08 10:00
LOG006.CSV 04/06/09 10:00
LOG007.CSV 04/06/10 10:00
Suffixes are automatically added to
file names set in the CX-Designer.
It is possible to make a one-week log
by automatically saving the data
seven times.
Logging data for each day (43,200 points)
is saved in the Memory Card in CSV format.
Memory
Card
Automatically saved
(1) Graphs can be superimposed. (2) The display can be magnified.
D0000
D0001
D0002
X1
Y1
X2
Y2
X3
Y3
(X1, Y1)
(X2, Y2)
(X3, Y3)
Y
X
PLC
Information in the PLC's format can be plotted
moment-by-moment.

 Loading...