1-7-1
11
60
80
80
60
40
100
120
140
352515 455-15
100
120
-5 -10 50 10-5
120
40
60
80
100
120
40
60
80
100
15 20-25 -15-20
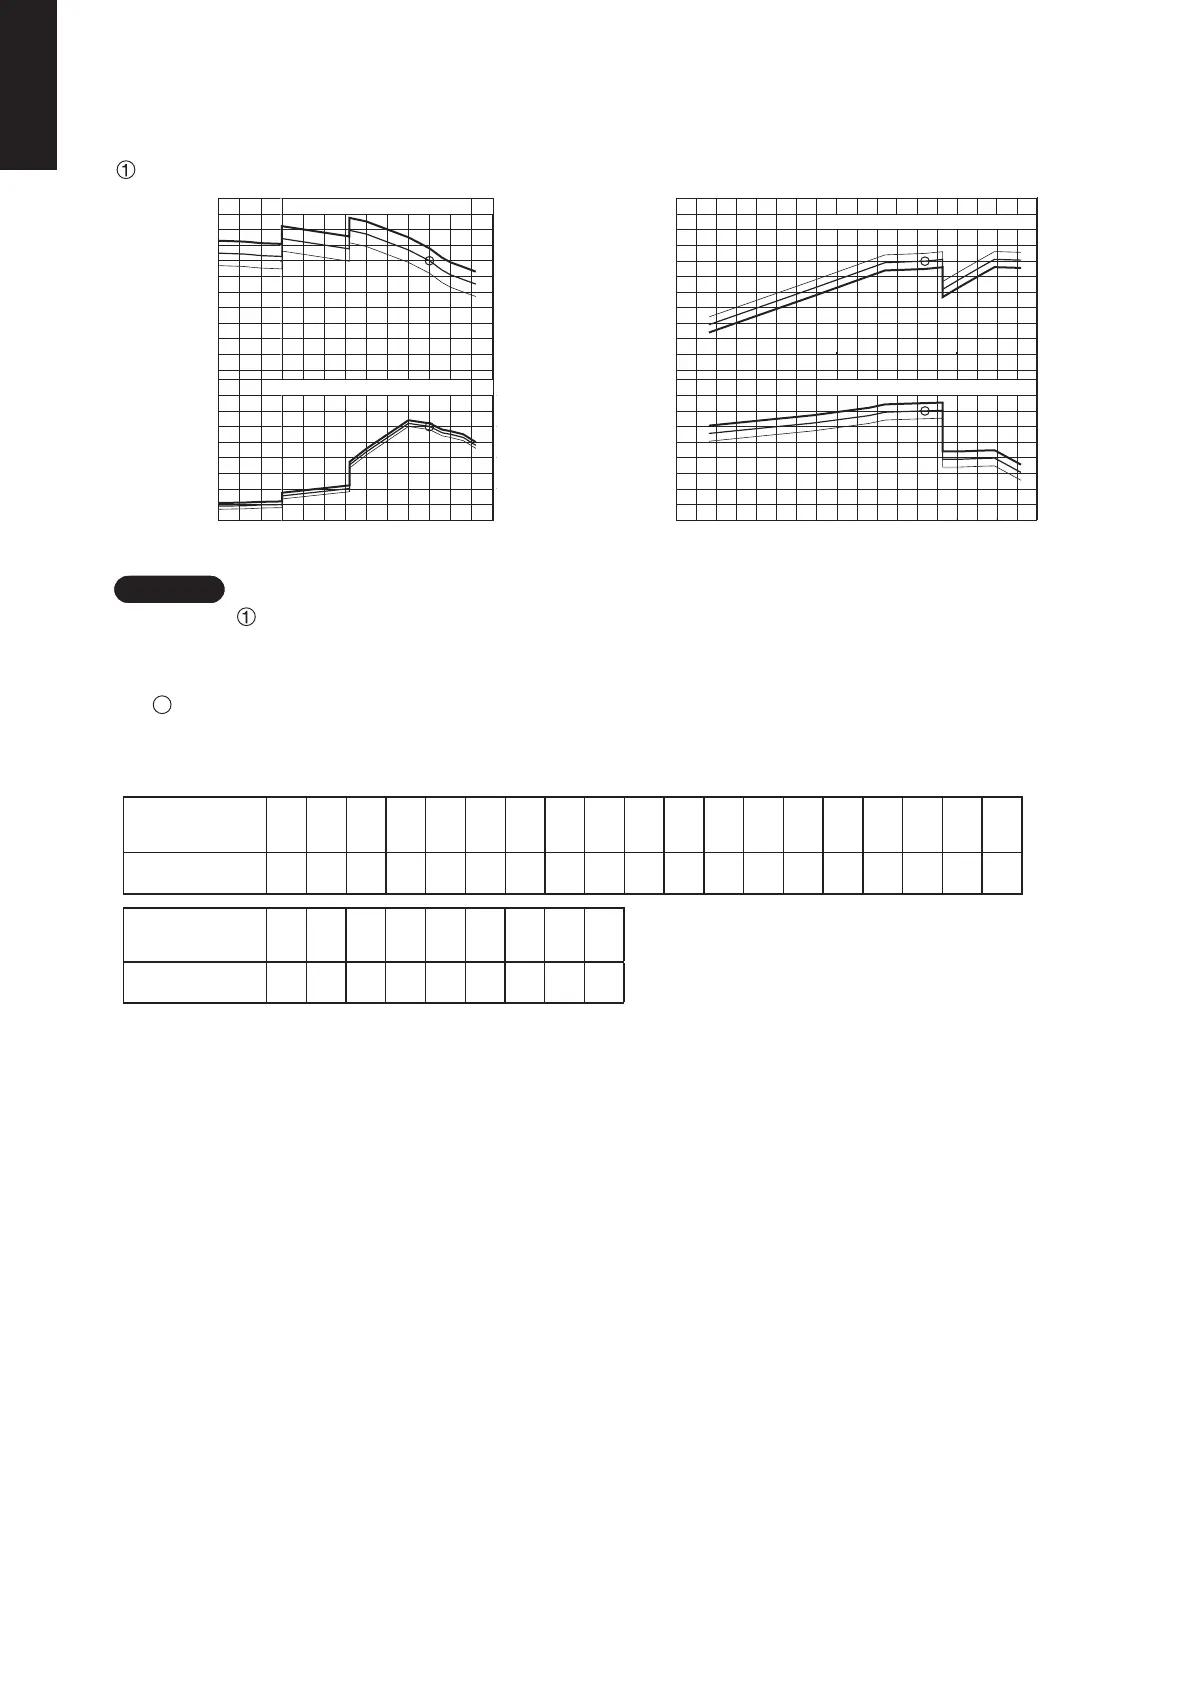
Input coefficient (%) Capacity coefficient (%)
Input coefficient (%) Capacity coefficient (%)
Cooling capacity ratio (maximum capacity) Heating capacity ratio (maximum capacity)
1-7. Capacity Correction Graph According to Temperature Condition
U-160PZH2R5 / U-160PZH2R8 / U-180PZH2R8 / U-200PZH2R8 / U-224PZH2R8 (For 50 Hz)
Indoor air intake temp (WB)
19WB
16WB
22WB
22WB
19WB
16WB
Indoor air intake temp (WB)
Outdoor air intake temp (°C DB)
16
°C
20
°C
24
°C
Outdoor air intake temp (°C WB)
24
°C
20
°C
16
°C
1. The graphs " " of the characteristics show the value under the following conditions.
Equivalent tubing length : 7.5m
Difference of elevation : 0m
Wind speed : High
2. " " marking indicates the maximum capacity / maximum power consumption.
Maximum capacity indicates the maximum value in the parentheses of the specifications (cooling and heating capacity).
3. The characteristic of heating capacity excludes the decline of capacity when frosting (including defrost drive).
NOTE 1
Indoor air intake temp (
°C
DB)
Indoor air intake temp (
°C
DB)
Outdoor unit heating capacity correction cofficient during of frosting/defrosting
Outdoor intake air
temperature °C WB
-20
0.880
-21
0.880 0.880 0.880 0.880 0.880 0.880 0.860 0.830 0.8300.8800.8800.8800.8800.8800.8800.8800.8800.880
0.820 0.820 1.0000.9500.9100.8900.8500.8300.830
-19 -18 -17 -16 -15 -14 -13 -12 -11
-10
-9 -8
Correction coefficient
Outdoor intake air
temperature °C WB
Correction coefficient
-1 0 1 2 3 4 5 6-2
-7 -6 -5 -4 -3
To calculate the heating capacity with consideration for frosting/defrosting operation, multiply the heating capacity
found from the capacity graph by the correction coefficient from the table above.
Graph of capacity change characteristics resulting from tubing length and elevation difference
0
98
96
94
92 90 88
%
100
10 20 30 40 50 60 70 75
Elevation difference (m)
<Cooling>
Base capacity
change rate
Equivalent length (m)
(Performance correction coefficients by elevation difference of refrigerant tube length [performance change rate ÷ 100] is
calculated by the following line map.)
0
99
98
97 96 95 94 93 92
%
100
-30
-10
0
10
20
30
5010 20 30 40 70 7560
-20
-30
-10
0
10
20
30
-20
Elevation difference (m)
Equivalent length (m)
<Heating>
<Cooling>
<Heating>
Base capacity
change rate
0
98
96
94
92 90
%
100
10 20 30 40 50 60
Elevation difference (m)
Base capacity
change rate
Equivalent length (m)
0
99
98
97 96 95 94
%
100
-30
-10
0
10
20
30
50 6010 20 30 40
-20
-30
-10
0
10
20
30
-20
Elevation difference (m)
Equivalent length (m)
Base capacity
change rate
*The positive side for the elevation difference indicates that the outdoor unit is installed at a higher position than the indoor units.
The negative side indicates the opposite.
U-160PZH2R5
U-160PZH2R8 / U-180PZH2R8 (For 50 Hz)
U-200PZH2R8 / U-224PZH2R8 (For 50 Hz)
SM830277-00_大洋州向け R32シングル_TD&SM.indb 1 2019/02/27 11:50:34