Toll Free 1-800-443-5542 HERE TO HELP
[
15
]
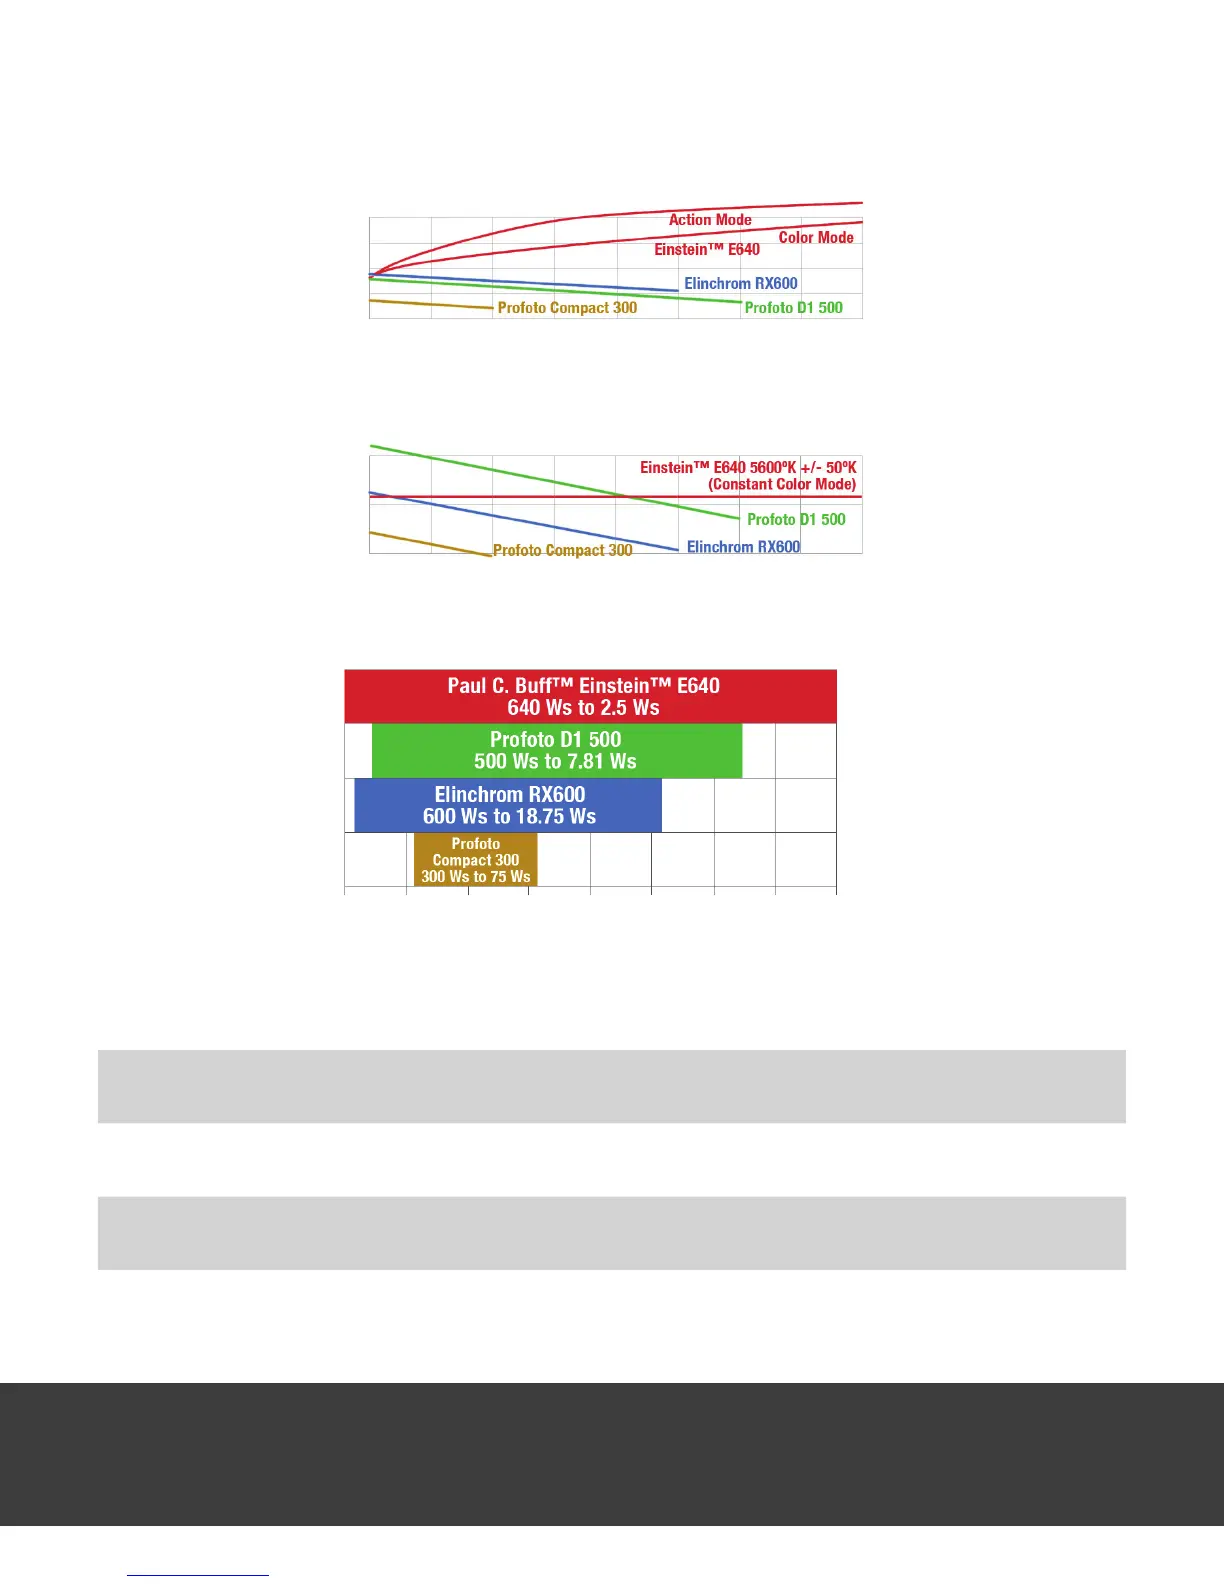
POWER VARIABILITY RANGE (Wattseconds)
640 320 160 80 40 20 5 2.5
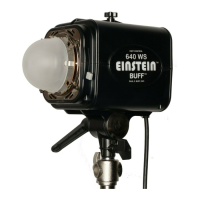
t.1 FLASH DURATION (Seconds) VS. POWER SETTING
COLOR TEMPERATURE VS. POWER SETTING
FULL 1/2 1/4 1/8 1/16 1/32 1/64 1/128 1/256
1/10000
1/3000
1/1000
1/300
1/100
6000º K
5500º K
5000º K
Color Temperature
(Kelvin)
Flash Duration
(fractions of 1 second)
Total Range in
True Wattseconds
(Graphs on pages 14 and
15 derived from published
specications and/or lab
testing by Paul Buff)
EXPECTED OUTPUT
Full Power (640 Ws)
with the 8.5” High-Output Reector
f22 +1/10 at 10 feet (GN 234)
Full Power (640 Ws)
with the 11” Long-Throw Reector
f32 +6/10 at 10 feet (GN 394)
Full Power (640 Ws)
with a softbox
f8 +7/10 at 10 feet (GN 102)
Readings taken at ISO100 in a 14’ x 14’ room with grey walls and oor. For details on expected output readings and mea-
surements takes with other accessories and at other power settings, see our website (www.paulcbuff.com/output.php).
FULL 1/2 1/4 1/8 1/16 1/32 1/64 1/128 1/256
10