53
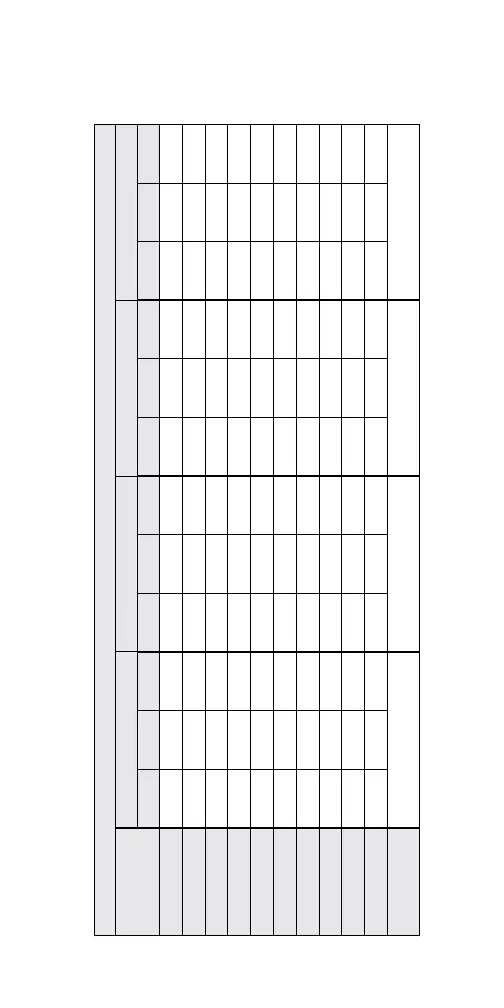
Load Chart 12: Wind Speed vs.
Pressure (Chart 1 of 2)
Wall Loads (psf) - End Zone (Zone 5) for 100sf to 500 sf effective wind area
Mean Roof
Height (ft)
90 MPH 100 MPH 110 MPH 120 MPH
Exp B Exp C Exp D Exp B Exp C Exp D Exp B Exp C Exp D Exp B Exp C Exp D
15
-15.1 -18.3 -22.2 -18.7 -22.6 -27.5 -22.6 -27.3 -33.2 -26.9 -32.5 -39.5
20
-15.1 -19.5 -23.4 -18.7 -24.1 -29.0 -22.6 -29.2 -35.0 -26.9 -34.7 -41.7
25
-15.1 -20.4 -24.3 -18.7 -25.2 -30.1 -22.6 -30.5 -36.4 -26.9 -36.3 -43.3
30
-15.1 -21.1 -25.1 -18.7 -26.2 -31.0 -22.6 -31.6 -37.5 -26.9 -37.7 -44.7
35
-15.9 -21.9 -25.7 -19.6 -27.1 -31.8 -23.7 -32.8 -38.4 -28.2 -39.0 -45.7
40
-16.5 -22.5 -26.3 -20.4 -27.9 -32.5 -24.6 -33.7 -39.3 -29.3 -40.1 -46.8
45
-16.9 -23.1 -26.9 -20.9 -28.6 -33.3 -25.3 -34.6 -40.2 -30.1 -41.2 -47.9
50
-17.5 -23.6 -27.3 -21.7 -29.2 -33.8 -26.2 -35.3 -40.9 -31.2 -42.0 -48.7
55
-18.0 -24.0 -27.8 -22.3 -29.7 -34.4 -26.9 -35.9 -41.6 -32.0 -42.8 -49.5
60
-18.4 -24.5 -28.2 -22.8 -30.3 -35.0 -27.6 -36.6 -42.3 -32.8 -43.6 -50.3
Net Design wind
pressure
-15.1 -18.7 -22.6 -26.9
More information on this chart can be found in Technical Bulletin #15 (www.pbssips.com).