Do you have a question about the PRÜFTECHNIK VIBXPERT and is the answer not in the manual?
Lists the physical components of the VIBXPERT FFT data collector and signal analyzer.
Details data acquisition capabilities including overall values and signals.
Describes the device's user interface, screen, and controls for ease of use.
Explains battery operation, charging, and power management features.
Outlines PC connectivity options via network and USB.
Refers to printing reports and product catalogs.
Explains the manual's scope, valid firmware version, and Ex symbol usage.
Lists components included in standard and 'Trending' 1-channel device packages.
Details components for intrinsically safe 'Diagnosis' and 'Trending' packages.
Explains warning, attention, note, and intrinsic safety symbols.
Defines the permissible use of the measurement device and transducers.
Safety rules for using the device in potentially explosive environments.
Installation and operation regulations for intrinsically safe devices.
Lists specific interface electrical parameters for Ex protection.
Describes the information found on the nameplate of the intrinsically safe EX device.
Details the device and battery nameplates for the standard version.
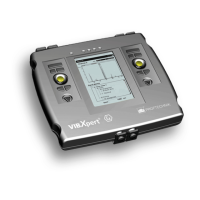
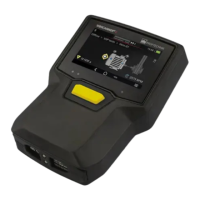
Overview of device interfaces, operating elements, and ports.
Details the function of each key and the joystick for device operation.
Explains the meaning of different LED indicators for status and alarms.
Describes GUI interaction, device power on/off, and reset procedures.
Explains the front panel connectors for analog, digital, and temperature signals.
Highlights interface differences for intrinsically safe models, including separate charging socket.
Details battery status display and charging the device.
Explains how to use the optional external charging station for the battery.
Describes power for Ex devices and the use of carrying pouches and straps.
Covers installation, replacement, and handling of the CompactFlash memory card.
Discusses card formatting, detection of faults, and checking free memory capacity.
Guides users through initial device configuration and setup.
Explains how to set the device's date, time, timezone, and daylight saving.
Covers screen contrast, backlight, background images, and other display options.
Configuration settings related to the 'Route' measurement mode.
Options for displaying route data in tree or list view, including graphic routes.
Details hierarchy display, skipping locations, and jump settings in route mode.
Configuration for auto-start measurements and route optimization.
Manages automatic sensor detection and amplifier settling for measurements.
Manual procedure to check the measurement path to the sensor.
Setting a default sensor for 'Multimode' measurements.
Extends time limits for RPM/phase measurements and defines trigger edge.
Instructions for changing the device's user interface language.
Details how to register optional functions and modules via password.
Explains the VIBXPERT PC license and device registration process.
How to select measurement units for various quantities.
Customizing additional keys and defining 'Save?' prompts for security.
Overview of printing measurement results and reports via USB.
Steps to connect and configure a USB printer.
How to cancel a pending print job from the queue.
Instructions for physically connecting a USB printer using a cable.
Configuring analog output for signals and headphones, including normalization.
Access to functions for service, maintenance, and training purposes.
Displays device information for service and repair purposes.
Procedure to maintain measurement accuracy by compensating electronic offsets.
Resets instrument settings to factory values and deletes unnecessary files.
How to use the demo mode for training and demonstration purposes.
Sets the level of detail for logging operating steps for troubleshooting.
Procedures for formatting, checking, and repairing the CF memory card.
Setting the factor for converting spectrum amplitudes to decibels.
Removing unneeded background images or company logos.
Overview of transferring measurement tasks and data to/from a PC.
Details for connecting non-EX devices directly to a PC via Serial, USB, or Ethernet.
Details for connecting intrinsically safe EX devices via Serial, USB, or Ethernet.
Setting up network communication for data transfer.
How to find the PC's IP address and subnet mask for network configuration.
Manually assigning a fixed IP address to the computer for direct connections.
Steps to download and prepare for device software updates via Internet.
Completing the software update process on the VIBXPERT device.
Describes the Multimode operating mode for direct measurements and analysis.
Explains using VIBXPERT as a data collector for routes and templates.
Mentions the device's capability for dynamic balancing in one or two planes.
Lists essential checks before performing any measurement.
Defines a measurement task and explains its structure and parameters.
How to activate and navigate the Multimode measurement mode.
Outlines the general steps for conducting a Multimode measurement.
Describes how to view live measurement data and signal stability.
Procedure for saving measurement results using the file manager.
Overview of the 'Route' mode for scheduled data collection.
Notes on route flexibility, interruption, skipping elements, and data transfer.
Explains how adaptive tasks adjust routes based on machine condition.
Describes how to include visual inspection tasks in route measurements.
How to input numerical values acquired from external devices.
Information typically included in a route, like thresholds and historic data.
Steps for executing a route measurement and navigating locations.
Instructions on how to select and begin measuring a specific route.
Navigation tips for route data presented in a hierarchical tree structure.
Navigation tips for route data presented in a simple list format.
Steps to select a measurement task and start it within a route.
Explains the meaning of various icons indicating measurement task status and types.
Describes menu options for route navigation.
Explains menu options available in the task selection screen for routes.
Overview of the 'Machine template' mode for repetitive measurements on similar machines.
Compares machine templates to routes and highlights differences.
How to name and document machines for templates.
Details the 'Production test' option for templates, affecting automatic task progression.
Steps to select a machine template and begin measurements.
Describes the process after selecting a machine template for measurement.
General options available during the measurement process.
How to stop a measurement in progress.
Steps to re-measure the current or last result.
Methods for saving measurement results in Route/Machine template and Multimode.
How to select measurement channels (A, B, or A/B) in Multimode.
How to change measurement channels for Route/Machine templates.
How to select sensors for Route/Machine template measurements.
How to manually input RPM for Route/Machine template measurements.
How to select an existing measurement task in Multimode.
Steps to create a new measurement task in Multimode.
How to create new measurement, evaluation, or RPM setups.
Procedure to view parameters of existing setups.
Checking where a specific setup has been previously applied.
Details parameters for overall values and advanced measurement types.
Setting the measurement range for analog channels.
Setting the low-pass filter for coastdown and phase analysis.
Selecting appropriate window functions for spectrum analysis.
Configuring trigger settings for various measurement types.
Setting the angular displacement between sensors for orbit measurements.
Options for displaying orbit time waveforms over multiple rotations.
Details measurement tasks related to signal analysis types.
Setting the filter type for envelope analysis.
Setting the resolution of spectrum analysis.
Detailed explanation of window function characteristics.
Explains different averaging methods and their application.
Details on setting up sensor parameters, including default settings.
Setting alarm, warning, and pre-warning limits for overall values and time waveforms.
Manual entry of RPM values for measurements requiring RPM data.
How to record information related to data collection using events and comments.
Steps for adding events and comments to measurement results.
How to remove events or comments from a route.
Adjusting the sensitivity of the analog output signal.
How to access and utilize historical data within a route for trend analysis.
Options for saving current results to extend or replace existing trend data.
Starting trend analysis for measurements saved in Multimode.
How to view individual results for data types not suitable for trend display.
Comparing current measurement values against historical or reference data.
Setting up notifications for significant deviations in measurement values.
Overview of the 'Near location' function for simultaneous route measurements.
Details how measurement channels and locations are assigned for 'Near location'.
Lists limitations and requirements for the 'Near location' function.
How to skip measurement locations or tasks within a route.
How to disable the 'Near location' feature for a route.
Overview of using triaxial sensors for simultaneous 3-axis vibration measurement.
Explains the mapping of sensor axes and the assignment in OMNITREND.
Lists prerequisites for successful triaxial sensor measurements.
Step-by-step guide for performing measurements with a triaxial sensor.
Overview of the 'Recording' function for capturing data over time or RPM.
Details which measurement modes and tasks support recording and any limitations.
How to set up and configure the recording function.
Procedure to test the RPM sensor's function and positioning before recording.
How to view recorded overall values and configuration settings during recording.
Steps to initiate a measurement recording session.
Conditions under which a measurement recording session concludes.
Notes on device behavior during faults and specific recording characteristics.
Overview of the function for recording long-term time waveforms.
How to display and analyze recorded time waveforms on the device.
How to access and manage results from Multimode measurements.
How results are automatically saved and accessed in Route/Template modes.
Steps to view results from route or machine template measurements.
General guidance on how to interpret and evaluate measurement results.
Information displayed when viewing detailed results, such as task, channel, and sensor type.
How single overall values and limit exceedances are displayed.
How multiple overall values are displayed as trend curves.
Functionality for magnifying areas of trend diagrams.
How to remove erroneous measurements from trend data.
How time waveform results are displayed as XY diagrams and data fields.
How to zoom the time axis of a time waveform display.
How to adjust the amplitude scaling of a time waveform display.
Displaying RPM markers on time waveform plots to indicate rotation speed.
How to use cursors to analyze time waveform data.
Managing the display of delta cursors for detailed analysis.
Managing sideband cursors to identify modulations.
Switching between Cartesian and circular plot displays for time waveforms.
Calculating overall values from time waveform data.
Steps to compute and save a spectrum from a time signal.
How to display RPM data alongside time waveform results.
Averaging signals synchronously with RPM for clearer analysis.
Exiting the postprocessing functions.
Overview of spectrum and cepstrum display features and information.
Lists the 10 highest amplitudes in a spectrum for analysis.
Checking if threshold values were exceeded and how LEDs indicate alarms.
Using markers to identify characteristic frequencies in spectra.
Details the parameters shown for trending spectra.
Comparing current trend data with historical or reference values for analysis.
Displaying acceleration signal in the lower pane for test purposes.
Enabling and using cursors for harmonic and sideband analysis.
Using a strobe light controlled by the spectrum cursor for visual analysis.
How to manually enter the machine RPM after a measurement.
Calculating and displaying the RMS value of a spectrum.
Options for altering measurement quantity in spectra after initial calculation.
Comparing current spectra with reference or historical spectra in a waterfall diagram.
Managing cursors (Harmonics, Subharmonics, Sidebands) for spectrum analysis.
Displaying multiple spectra in a 3D waterfall diagram for analysis.
How to move through individual spectra in a waterfall diagram.
Rotating and tilting waterfall diagrams for better viewing.
Using main and delta cursors for 3D view analysis.
Zooming functions available for waterfall diagrams.
Zooming on specific axes (X or Z) in waterfall diagrams.
How to analyze single spectra after evaluating them from a waterfall.
Customizing how measurement results are displayed.
Checking signal quality before data collection in live mode.
Settings for displaying overall values, including limits and delta.
Settings for displaying trend curves, including line type and labeling.
Settings for spectrum and time waveform displays, including zoom and cursor options.
Display settings specifically for waterfall diagrams.
Display settings specific to Coastdown, Orbit, and Phase measurement types.
Display settings for phase trends, including time or RPM dependence.
Display settings for dual-channel measurements, including spectrum and infos.
Options for displaying impact test results as time waveform or spectrum.
Overview of printing capabilities for reports, screenshots, and PDF files.
Lists the types of reports that can be printed from VIBXPERT.
Steps required before printing, including connecting and setting up the printer.
How to print screenshots of the current measurement display.
Details the content and types of measurement reports available for various measurements.
Steps to create and customize measurement reports with company, logo, and customer info.
Option to include report-specific events in the measurement report.
Option to print result-specific events recorded during measurement.
Option to include measurement setup information in the report.
Steps to print a configured measurement report.
How to generate and print reports for route or machine template data.
Explains overall vibration values, ISO standards, and crest factor.
Overview of shock pulse measurement for bearing condition diagnosis.
Details the factors and process for normalizing shock pulse measurements.
Steps to set normalization parameters before a shock pulse measurement.
How to use the laser trigger sensor to measure machine speed (RPM).
Guidance on setting up the RPM measurement system, including sensor placement.
How to perform temperature measurements using type K thermocouple sensors.
Advice for accurate temperature measurements, including sensor handling and averaging.
Overview of analysis for machine startup and shutdown vibration behavior.
How to perform a runup measurement to analyze vibration during machine startup.
How to perform a coastdown measurement to analyze vibration during machine shutdown.
How to select runup/coastdown measurement tasks from the 'Advanced' tab.
Selecting tasks using icons in the 'Advanced' tab.
Selecting tasks using the Task Manager interface.
Steps to start runup/coastdown measurements, including temporary setup changes.
Additional information related to specific measurement types like Overall Value-RPM and Spectrum-RPM.
How overall vibration values are recorded relative to RPM.
How spectra are analyzed based on changing machine RPM.
Analyzing phase amplitude and angle in relation to machine RPM.
Switching between Bode and Nyquist diagrams for phase analysis.
Differences in displaying results from 2-channel measurements.
How measurement rate and RPM deviation affect data quality.
Overview and use of shaft centerline plots for analyzing shaft movement in bearings.
Specific parameters for setting up shaft centerline plot tasks.
Factors affecting accurate interpretation of shaft centerline plots.
Steps to perform a shaft centerline measurement and display the plot.
How to define and set the static shaft position in centerline plots.
Correctly mounting sensors and adjusting their arrangement for accurate shaft analysis.
Overview of phase measurement techniques, including synchronous and cross-channel.
Measuring phase with a reference transducer for fault identification.
Measuring phase difference between channels without a reference.
Filtering spectra and phase data by specific orders.
Magnifying diagram scaling for better visualization of phase vectors.
Assessing the quality of cross-channel measurements using the coherence factor.
Recording and displaying phase trends over time or RPM.
Overview of orbit measurements for analyzing shaft movement at constant speed.
Using cursors and zoom functions for orbit analysis.
Switching between individual signal displays and orbit plots.
Adjusting the order filter for orbit measurements.
Method for detecting impacts in machine vibration, used for bearing and tooth damage.
Analyzing spectra for regular structures, useful for complex patterns and damage diagnosis.
How to define custom measurement variables for specific inputs like voltage or pressure.
Combining similar measurement tasks to save time and improve efficiency.
How to evaluate multitask results based on stored thresholds.
How to view individual results within a multitask measurement.
How to create multitask configurations in OMNITREND for routes and templates.
Separating a multitask into individual tasks for route or template measurements.
Creating multitask configurations directly on the device using the Task Manager.
Setting up sensors and RPM recording for multitask tasks.
Defining measurement tasks for individual channels in multitask.
Configuring trigger settings for multitask measurements.
Overview of performing simultaneous measurements on two channels.
Steps to create new dual measurement tasks using the Task Manager.
What is displayed after completing a dual measurement.
How to navigate between different panes in the dual measurement results screen.
Overview of single-channel impact tests for resonance frequency determination.
Advice on setting parameters like trigger start and measurement range for impact tests.
Performing impact tests on running machinery using negative averaging.
How to access and display impact test results, including reference measurements.
Re-measuring individual impact tests for accuracy.
Overview of using two-channel impact tests for modal analysis and ODS.
Explains ODS analysis for visualizing dynamic behavior and vibration modes.
How to excite structures using an impulse hammer for analysis.
Steps to select and start modal analysis tasks.
Analyzing transfer functions and coherence in ODS measurements.
Assessing the quality of ODS measurements using the coherence function.
How system response and excitation are displayed in ODS results.
Overview of TrendingSpectrum for route mode, combining time signal, spectrum, and overall values.
Analyzing spectra based on multiples of the shaft rotational frequency (orders).
Converting frequency data into orders for comparison across different RPMs.
How to record the DC component of signals for specific measurement tasks.
Examples of using DC component data for evaluating process parameters or distances.
Activating DC measurement by setting lower frequency to 'DC'.
How to enter numeric values using the device's input editor.
Instructions for entering and deleting text using the device's editor.
How to manage saved measurement files, print files, and folders.
Describes the menu options available within the File Manager.
How to print PDF files saved on the device to a printer.
Overview of the utility software for firmware updates, data management, and file conversion.
Steps to install and launch the VIBXPERT utility software.
Process for enabling optional features by entering passwords.
How to establish network or USB connections for data transfer.
Updating firmware and transferring custom logo images for reports.
How to select and load background images for the device start window.
How to transfer PDF files, screenshots, and CSV results to a PC.
Backing up and restoring device configuration and formatting the memory card.
Overview of the VIBCODE system for identifying measurement locations.
Explains the physical coding mechanism of VIBCODE sensors and locations.
How measurement locations are linked to the database via mechanical coding.
Explains the difference between VIBCODE routes and pools for measurement organization.
Instructions for correctly connecting and using VIBCODE sensors for measurements.
Steps to measure VIBCODE locations within routes or pools.
General information on device care, storage, and cleaning.
Guidelines for proper storage conditions to protect the device.
Instructions on how to clean the device housing and display.
Information on device calibration, offset compensation, and recommended intervals.
Details the device's warranty period and conditions.
Information on obtaining original spare parts and accessories.
Environmental guidelines for disposing of the instrument and its battery.
Comprehensive specifications covering input/output channels, computer, and mechanical properties.
Lists measurement modes and functions available for the 1-channel firmware.
A comprehensive list of available measurement types and functions.
Measurement modes and functions exclusive to the 2-channel version.
Common symptoms, causes, and solutions for device issues.
Detailed steps for recovering the device by reloading firmware.
Completing the firmware reload process using the update tool.
Overview of available firmware modules, their order numbers, modes, and features.
Lists the different operating modes available on the VIBXPERT device.
Lists various measurement quantities and specific types supported by the device.
Identifies the equipment as VIBXPERT EX, FFT data collector & signal analyzer.
Specifies the product configuration details as per the declaration.
| Measurement Type | Vibration, Bearing Condition |
|---|---|
| Data Storage | Internal memory |
| Battery Life | Up to 10 hours |
| Connectivity | USB |
| Channels | 2 |
| Operating Temperature | -10 °C to +50 °C (14 °F to 122 °F) |
| Storage Temperature | -20 °C to +60 °C (-4 °F to 140 °F) |