2. PRODUCT INTRODUCTION
-2.5 Charging Stages Introduction
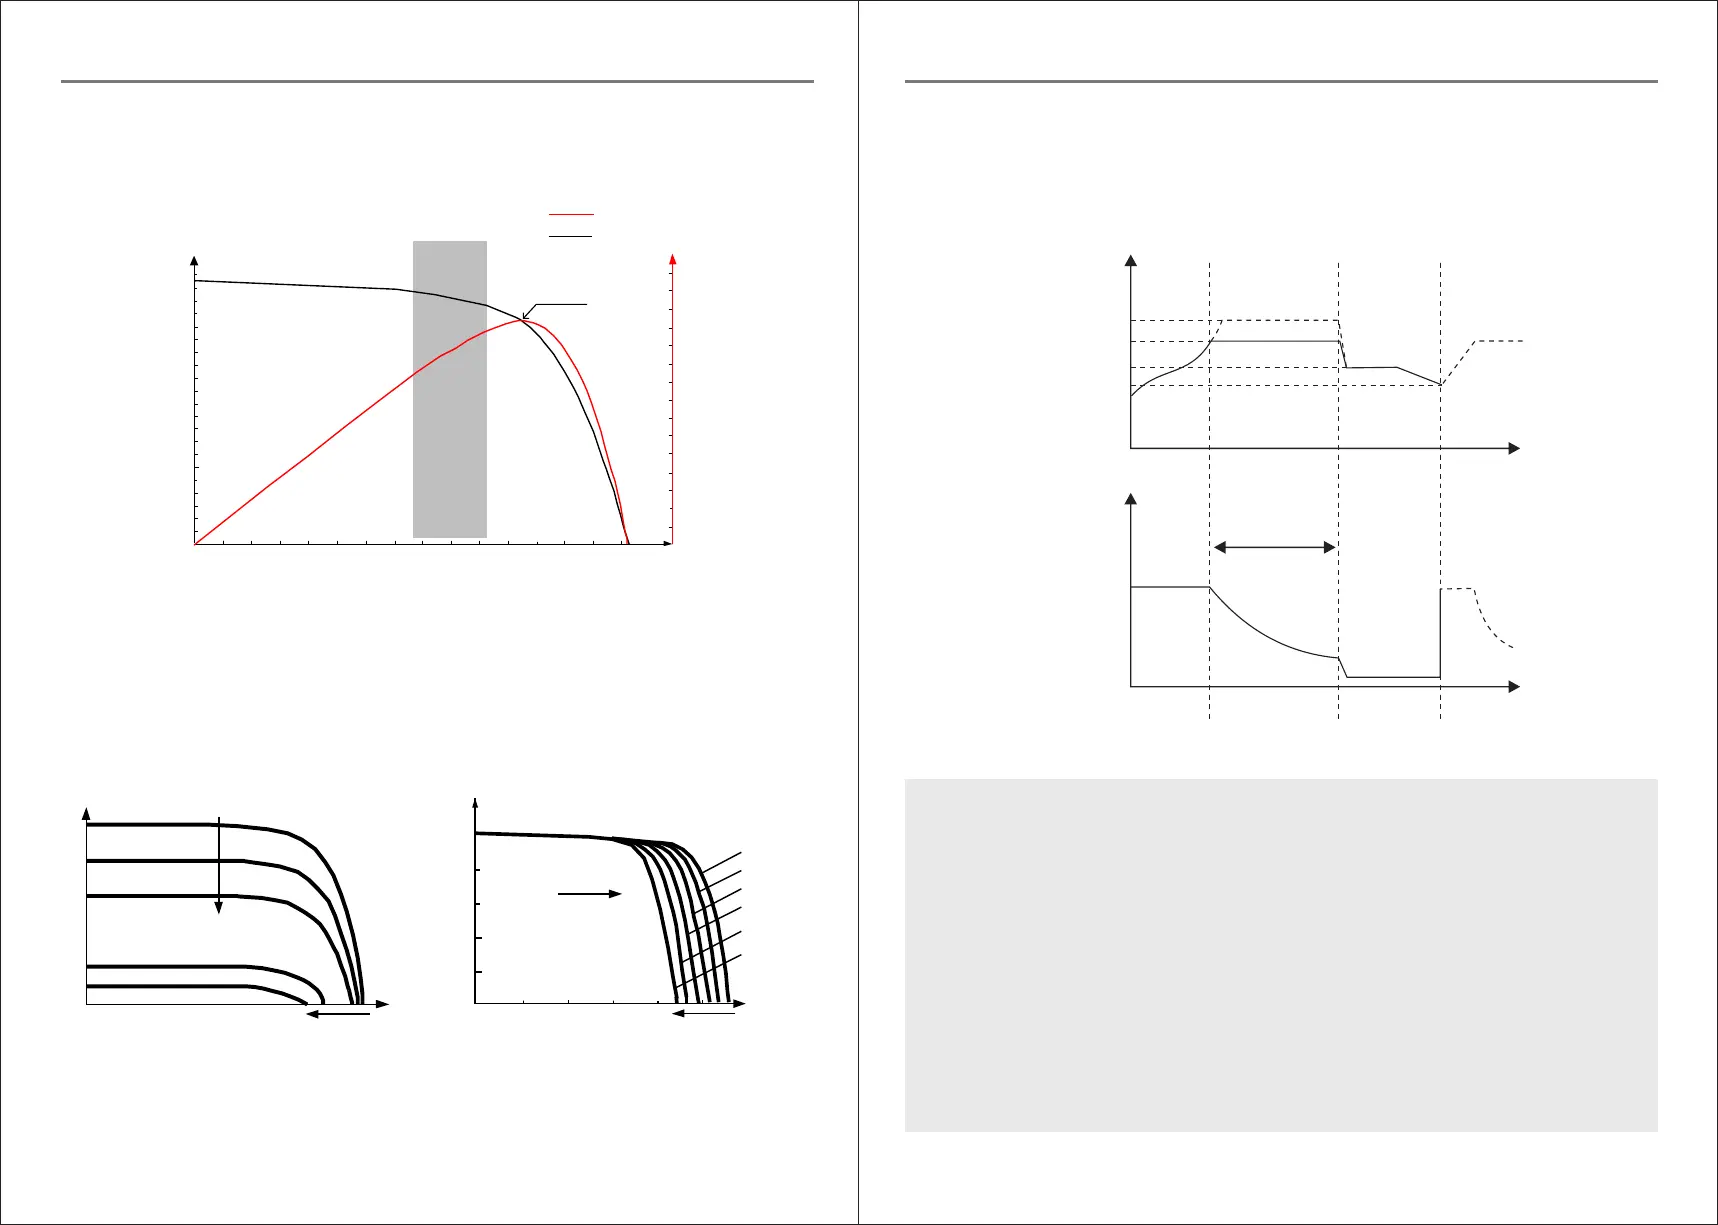
As one of the charging stages, MPPT can not be used alone, but has to be used together with boost charging, floating charging, equalizing
charging, etc. to complete charging the battery. A complete charging process includes: fast charging, sustaining charging and floating
charging. The charging curve is as shown below:
Fig. 1-5 Battery charging stages diagram
A B
C
Boost
Bu
lk
Equalizing charging voltage
Boost charging voltage
Floating charging voltage
Charging return voltage
Fast charging
Sustaining charging
Floating charging
Max. current
Duration: 2h
(range: 10 to 600min)
Cumulative time: 3h
Charging Current
Time
Battery voltage
Time
a) Fast charging
At the fast charging stage, as the battery voltage has not reached the set value of full voltage (i.e. equalizing / boost voltage) yet,
the controller will perform MPPT charging on the battery with the maximum solar power. When the battery voltage reaches the
preset value, constant voltage charging will begin.
When the battery voltage reaches the set value of sustaining voltage, the controller will switch to constant voltage charging. In
this process, no MPPT charging will be performed, and meanwhile the charging current will also gradually decrease. The
sustaining charging stage itself consists of two sub-stages, i.e. equalizing charging and boost charging, the two of which are not
carried out in a repeated manner, with the former getting activated once every 30 days.
By default, boost charging generally lasts for 2h, but users can adjust preset values of duration and boost voltage point according
to the actual needs. When the duration reaches the set value, the system will then switch to floating charging.
b) Sustaining charging
> Boost charging
2. PRODUCT INTRODUCTION
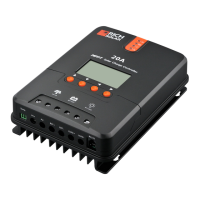
Compared with conventional PWM controllers, the MPPT controller can make the most of the solar panel's max. power and therefore provide
larger charging current. Generally speaking, the latter can raise the energy utilization ratio by 15% to 20% in contrast with the former.
U
(
V
)
I
(
A
)
P
(
W
)
VP curve
VI
94. 5
81. 0
67. 5
54. 0
27. 0
40. 5
13. 5
0. 0
19. 616. 814. 011. 28. 45. 62. 80. 0
0. 5
1. 0
1. 5
2. 0
2. 5
3. 0
3. 5
4. 0
4. 5
5. 0
MPPT point
curve
PWM
charging
Fig. 1-2 Solar panel output characteristic curve
Meanwhile, due to changing ambient temperature and illumination conditions, the max. power point varies frequently, and our MPPT
controller can adjust parameter settings according to the environmental conditions in real time, so as to always keep the system close to
the max. operating point. The whole process is entirely automatic without the need of human intervention.
Fig. 1-3 Relation between solar panel output
characteristics and illumination
U
(
V
)
I
(
A
)
Current decreases with dwindling light
Open-circuit voltage decreases with dwindling light
Fig. 1-4 Relation between solar panel output
characteristics and temperature
20 ℃
50 ℃
70 ℃
60 ℃
40 ℃
30 ℃
I (A)
U( V)
With temperature dropping,
current stays stable and
power increases
Open-circuit voltage decreases with rising temperature
Solar panel temperature
04
03
 Loading...